Murrey Math Lines 14.07.2017 (AUD/JPY, NZD/USD)
AUD JPY, “Australian Dollar vs Japanese Yen”
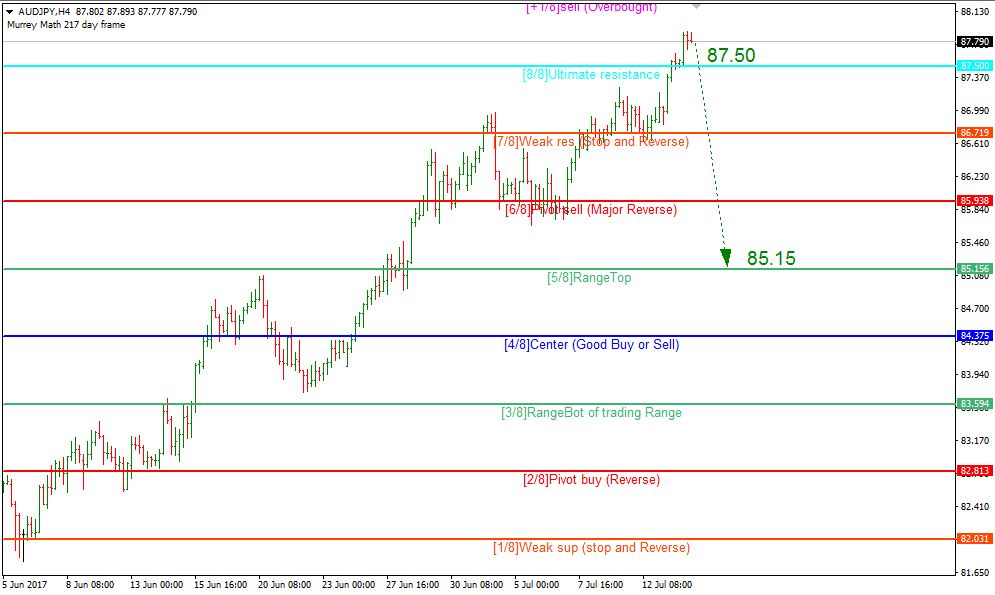
At the H4 chart, the AUD/JPY pair broke the resistance at the 8/8 level at 87.50 and is still moving inside the “overbought zone”. If later the price breaks the 8/8 level to the downside, it may continue falling towards the 5/8 one at 85.15.
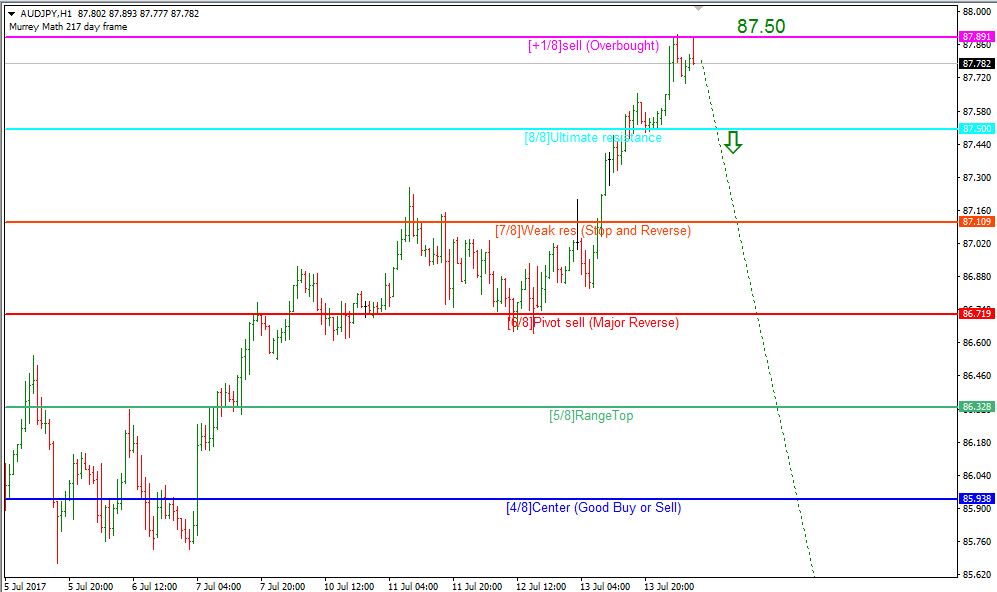
At the H1 chart, the price is trading close to the resistance at the +1/8 level. If the pair rebounds from this level, it may break the 8/8 one at 87.50 and continue moving downwards.
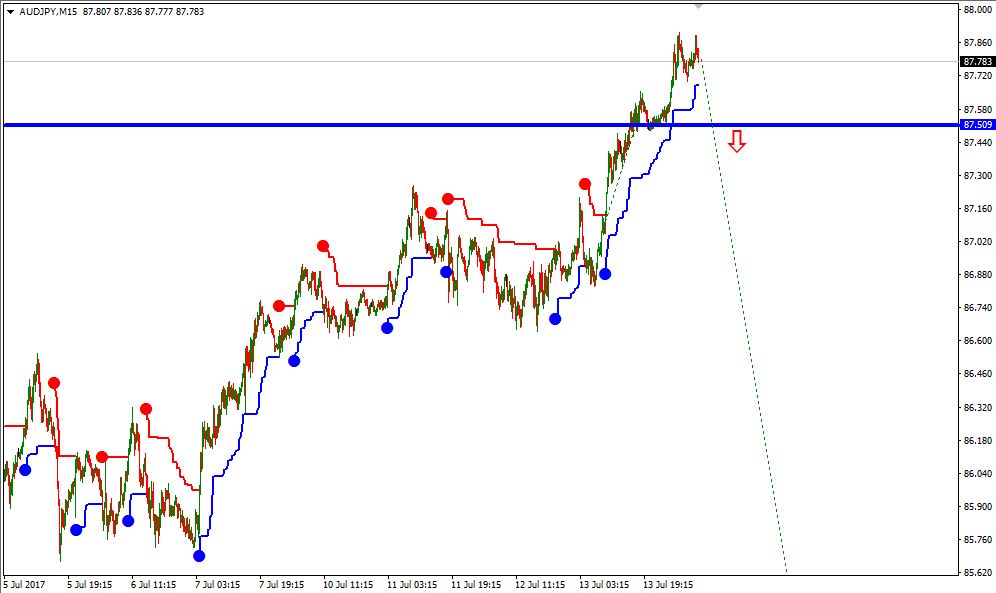
At the M15 chart, the price may break the downside line of the VoltyChannel indicator, thus confirming a possible reverse and a new decline towards 85.15.
NZD USD, “New Zealand Dollar vs US Dollar”
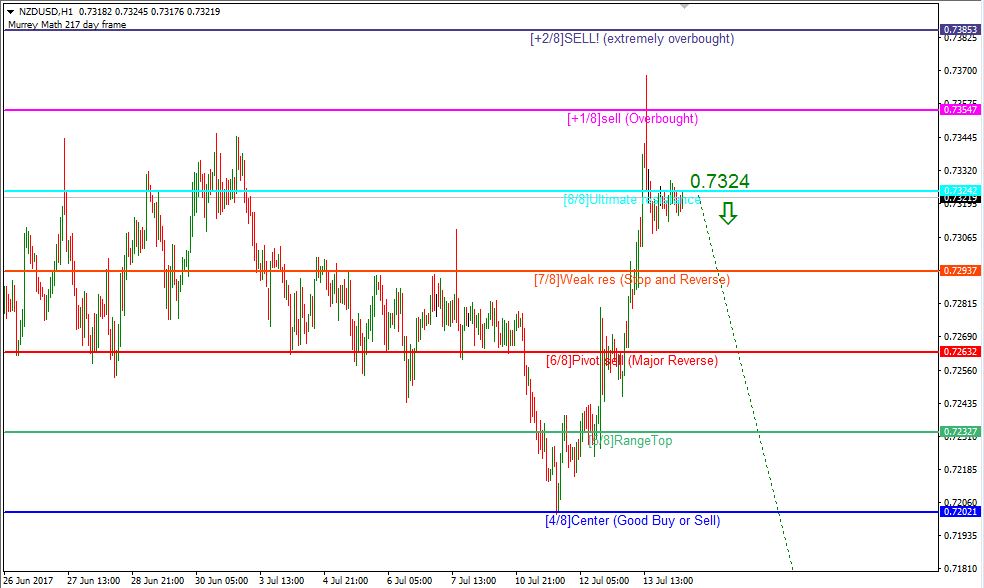
At the H4 chart, the NZD/USD pair is trading close to the strong resistance at the 8/8 level at 0.7324. The price is expected to rebound from it and start falling towards the 5/8 one at 0.7141.
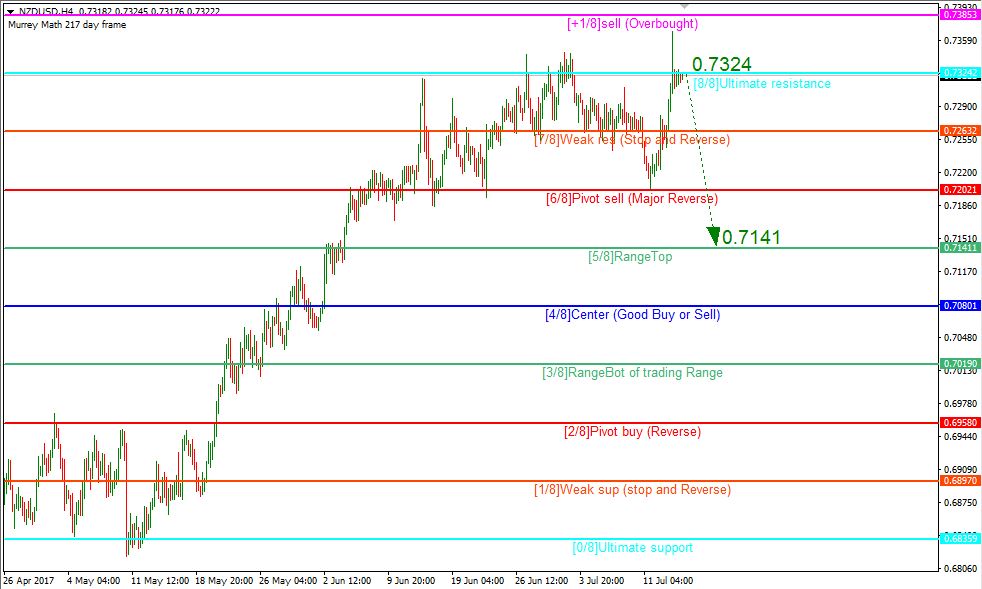
The levels at the H1 and H4 charts are similar. Here, the pair is also moving close to the resistance at the 8/8 level at 0.7324 and, as a result, may continue moving downwards to reach 0.7141.
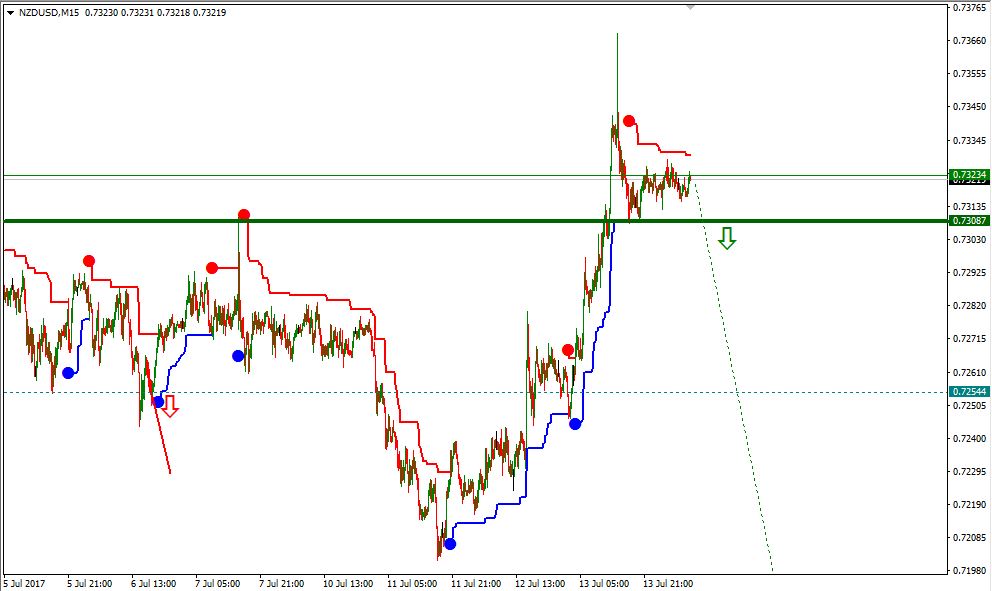
At the M15 chart, the pair may break the downside line of the VoltyChannel indicator and, as a result, continue its descending movement towards 0.7141.
RoboForex Analytical Department
Forecasts presented in this section only reflect the author’s private opinion and should not be considered as guidance for trading. RoboForex bears no responsibility for trading results based on trading recommendations described in these analytical reviews.