Murray Math Lines 18.07.2017 (EUR/USD, EUR/CAD)
EUR/USD
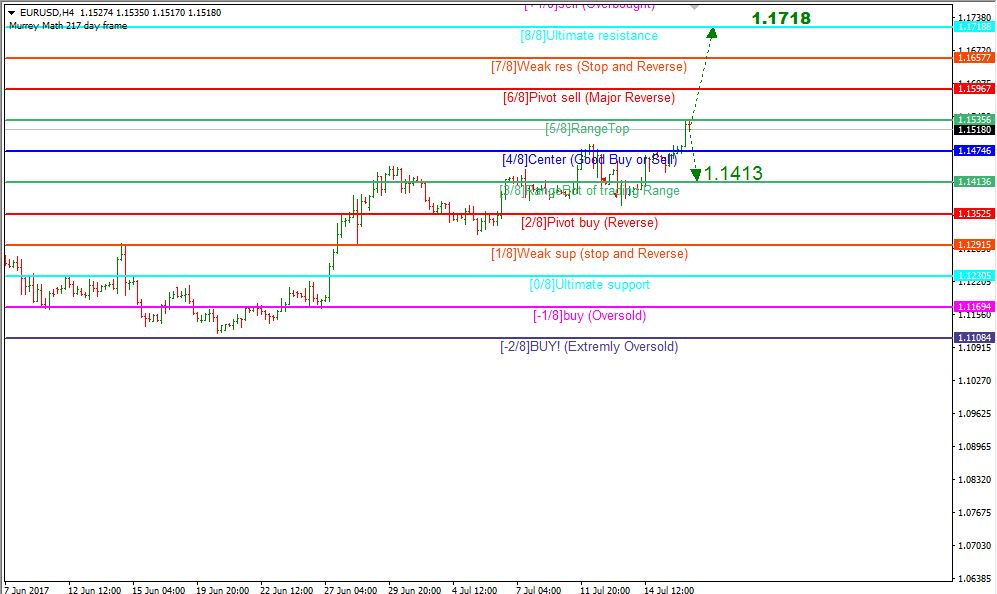
On the H4-chart the EUR/USD is being traded within the channel formed by 5/8 and 3/8 levels. A rebound from 5/8 level (1.1535) and decline towards 4/8 and 3/8 level can be expected. If the price breaks through the 5/8 level, it can rise further towards 8/8 (1.1718).
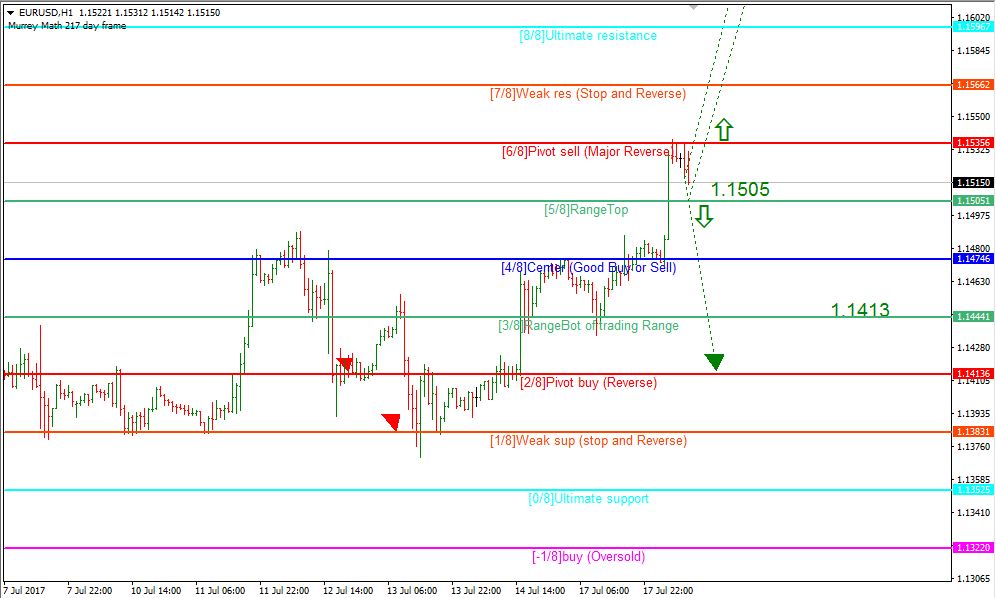
On the H1-chart we see that if the price rebounds from 5/8 level, it can move higher towards 1.1718. If the pair breaks through 5/8 level (1.1505), another downside move towards 1.1474 and 1.1413 can be expected.
EUR/CAD
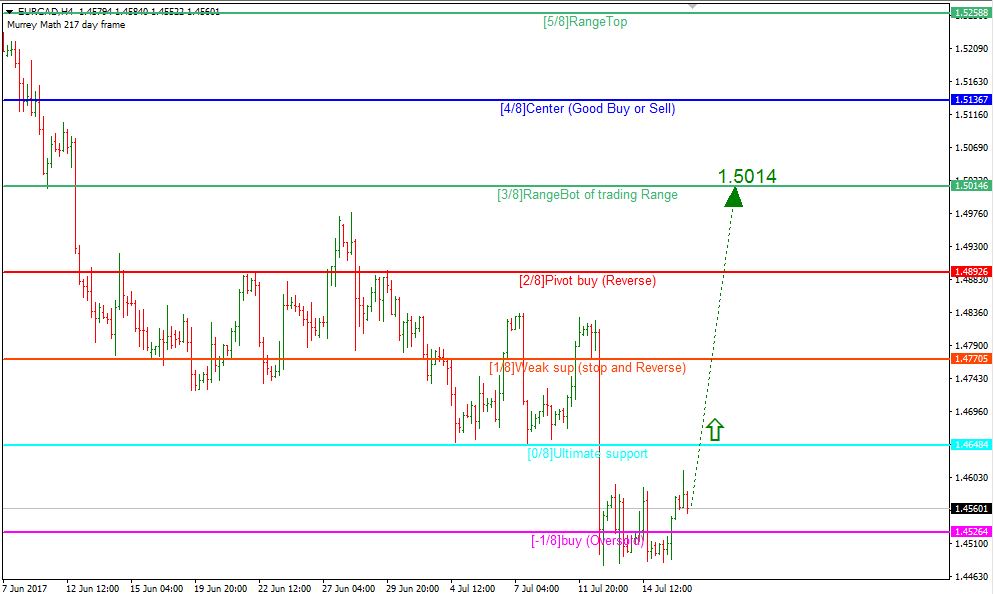
On the H4-period the EUR/CAD pair is being traded within an overbought area near -1/8 level. If the 0/8 level (1.4648) is broken through, this will trigger a further rise towards 3/8 (1.5014).
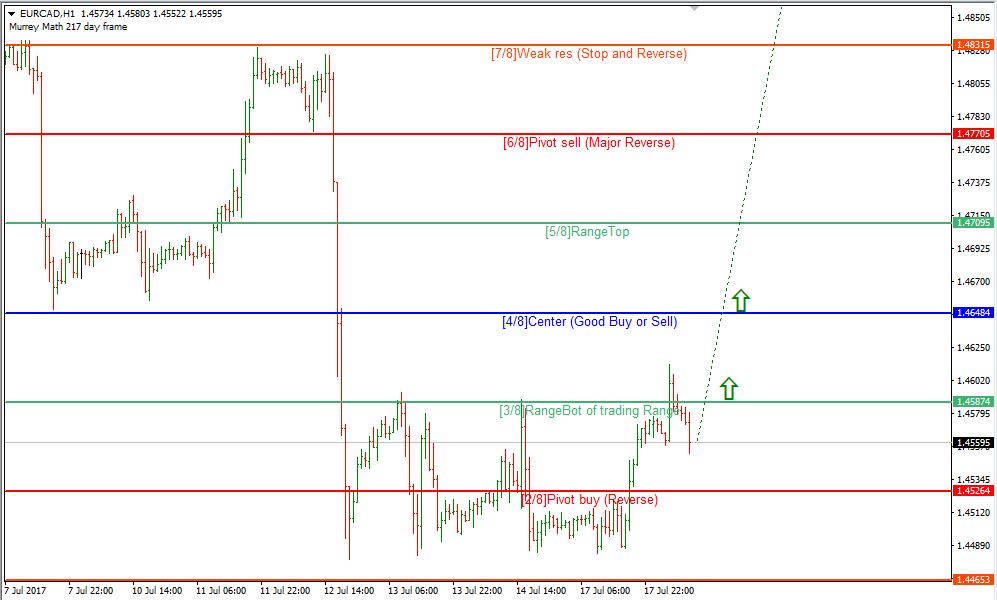
On the H1 chart the price holds below the 3/8 level (1.4587). If this level is broken through, there will be strong possibility that the price rises towards 1.5014.
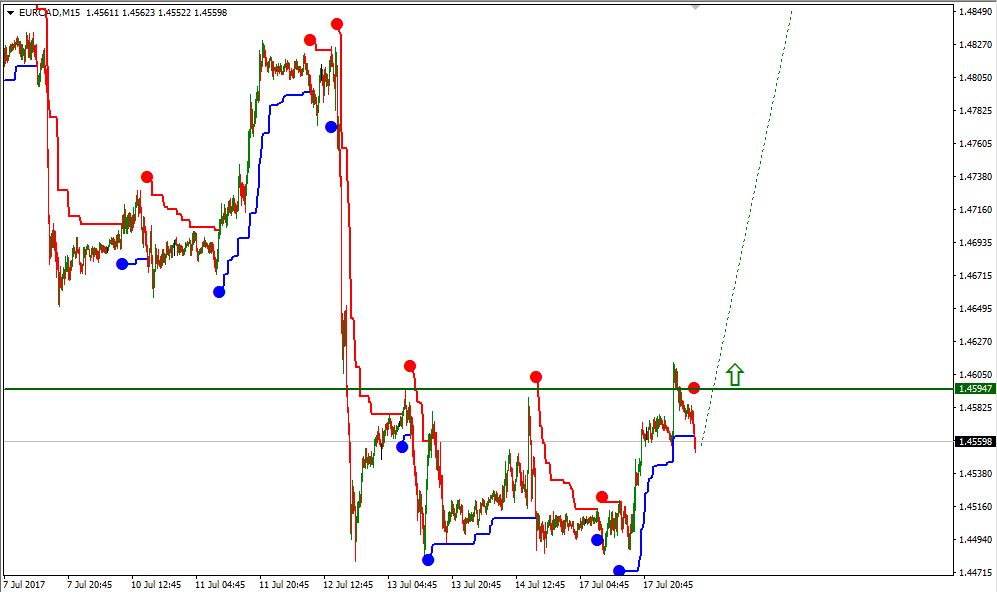
On the M15 chart a breakout of the upper line of VoltyChannel indicator can be expected. If this happens, a further rise towards 1.5014 can occur.
Forecasts presented in this section only reflect the author’s private opinion and should not be considered as guidance for trading. RoboForex bears no responsibility for trading results based on trading recommendations described in these analytical reviews.