Murrey Math Lines 06.07.2017 (NZD/USD, EUR/GBP)
NZD/USD, “New Zealand Dollar vs US Dollar”
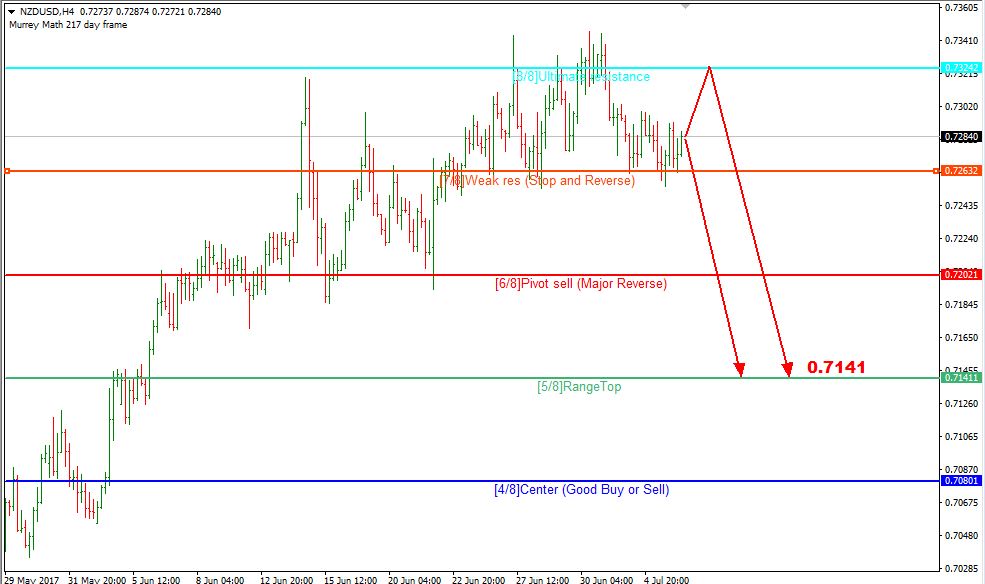
As we can see at the H4 chart, the NZD/USD pair is trading close to the “overbought zone” and the resistance at the 8/8 level at 0.7324. The price is still expected to move downwards and reach the target at the 5/8 level at 0.7141.
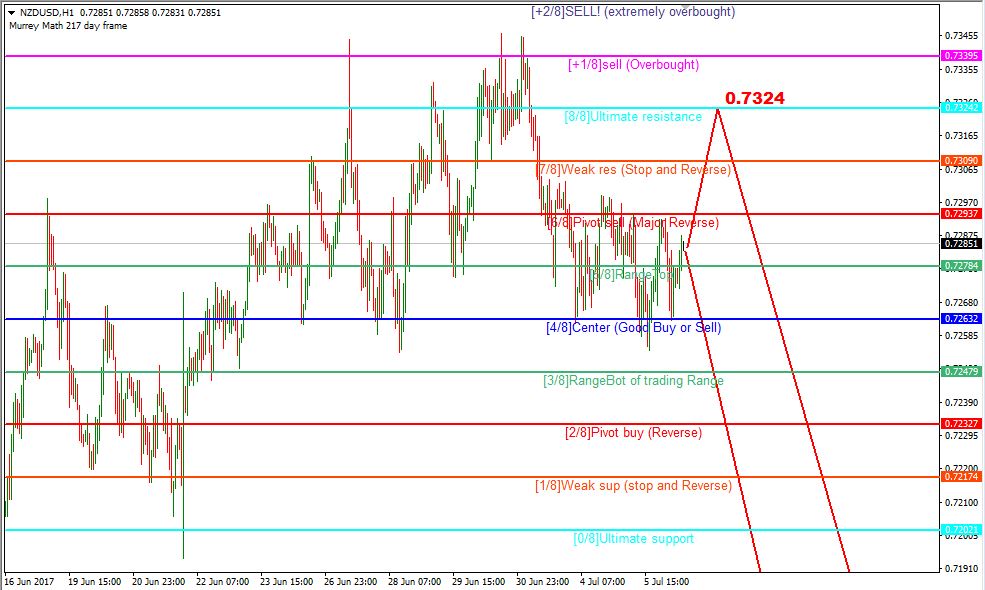
At the H1 chart, there might be two possible scenarios. The first one implies that the pair may grow towards the 8/8 level at 0.7324 and rebound from it. The second one suggests that the instrument may break the 4/8 level at 0.7263 and then continue falling towards the 5/8 level from the H4 chart at 0.7141.
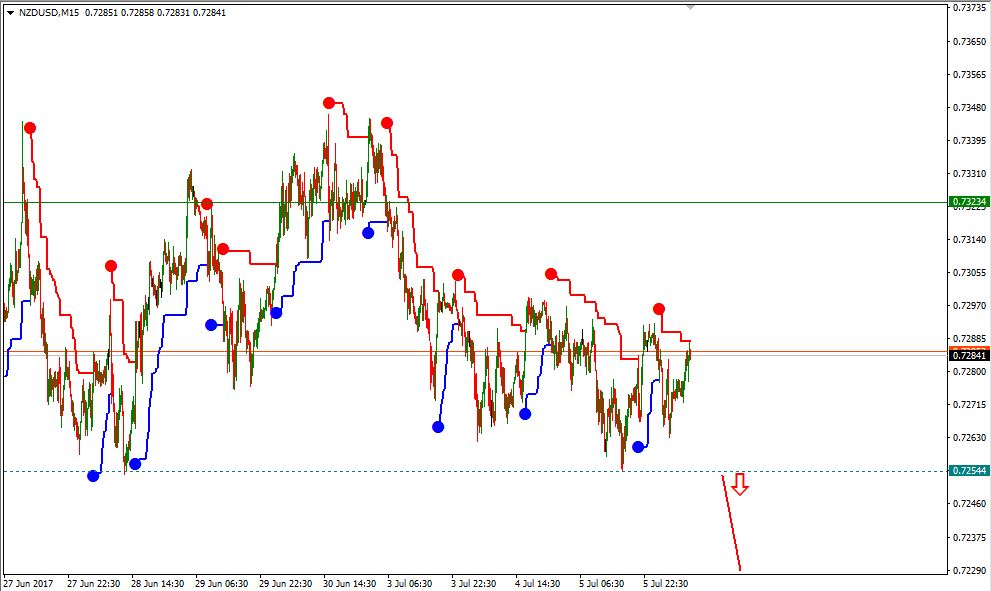
At the M15 chart, the pair broke the downside line of the VoltyChannel indicator. However, we should wait until the pair reaches new lows at 0.7254.
EUR GBP, “Euro vs Great Britain Pound”
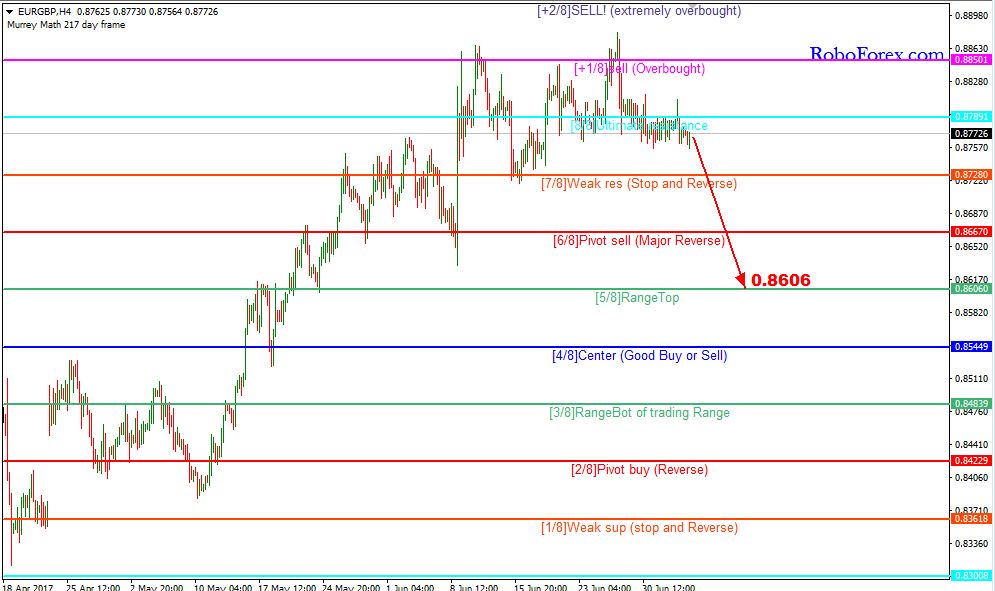
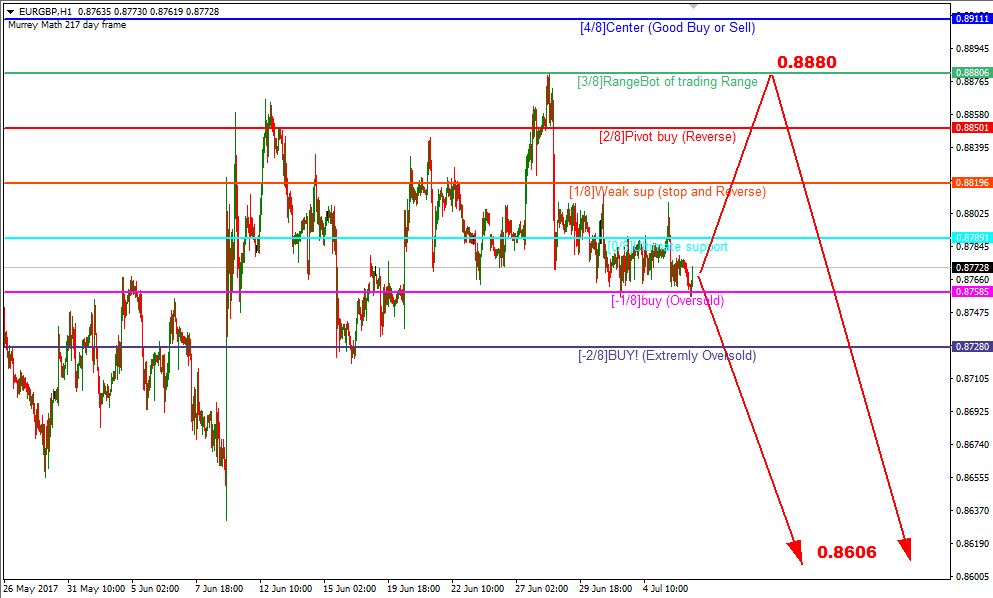
At the H4 chart, the EUR/GBP pair may yet move downwards to reach the 5/8 level at 0.8606.
As we can see at the H1 chart, the pair may probably grow towards the 3/8 level at 0.8880 and rebound from it. If the price breaks the support at the -2/8 level at 0.8728, the instrument may continue moving downwards to reach the 5/8 level from the H4 chart at 0.8606. If the -2/8 level is broken, the lines at the chart will be redrawn.
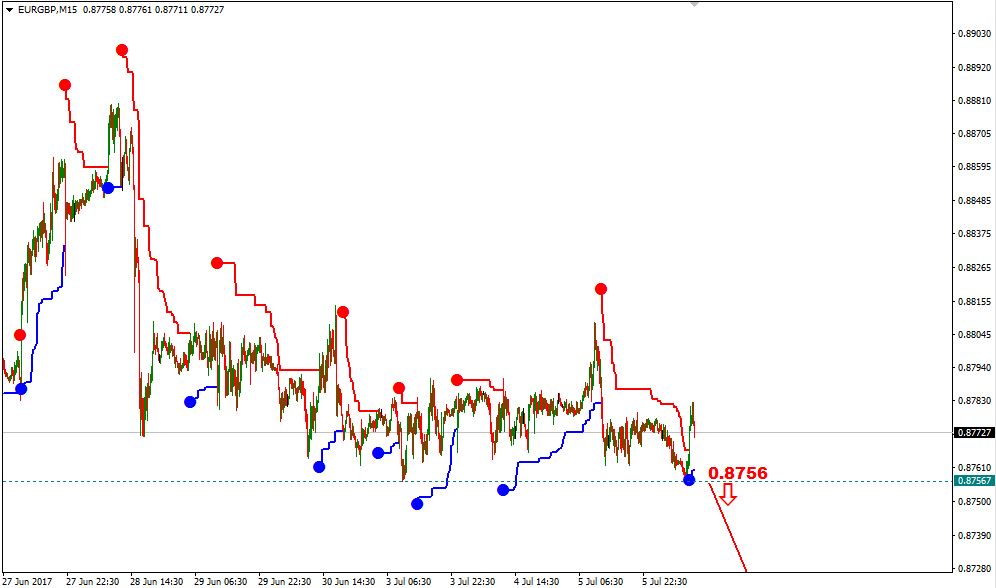
At the M15 chart, the pair broke the downside line of the VoltyChannel indicator. The price is expected to reach new lows at 0.8756 and then continue falling. If the pair grows towards the 3/8 level from the H1 chart at 0.8880, it may break the downside line of the VoltyChannel indicator to confirm the reverse.
RoboForex Analytical Department
Forecasts presented in this section only reflect the author’s private opinion and should not be considered as guidance for trading. RoboForex bears no responsibility for trading results based on trading recommendations described in these analytical reviews.