Wave Analysis 14.02.2017 (EUR/USD, GBP/USD, USD/JPY, AUD/USD)
EUR USD, “Euro vs US Dollar”
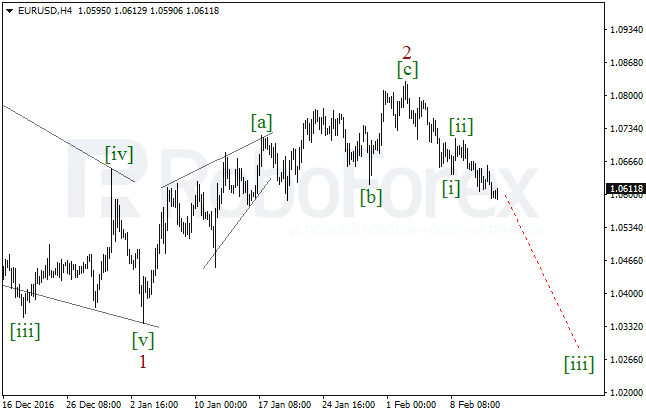
After finishing the zigzag in the wave 2, the EUR/USD pair resumed moving downwards. Possibly, at the moment the price is forming the descending extension in the wave [iii]. In this case, in the nearest future the market may continue falling and break the low of the wave 1.
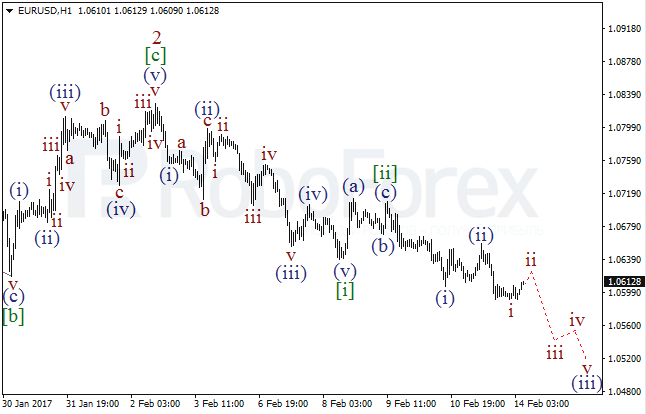
More detailed structure is shown on the H1 chart. After finishing the wave [ii], the pair completed the descending impulse in the wave (i) and the correctional wave (ii). As a result, on Tuesday, the market may continue moving downwards while forming the extended wave (iii) of [iii].
GBP USD, “Great Britain Pound vs US Dollar”
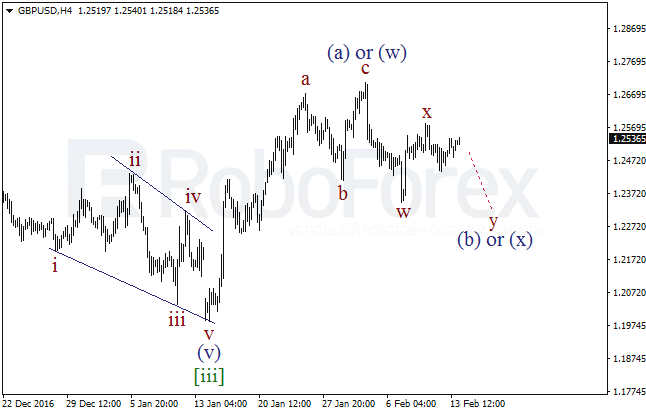
In case of the GBP/USD pair, the chart structure is still rather complicated. After finishing the wave [iii], the price started another correction and completed the ascending zigzag, which may be the wave (a) or (w). Consequently, in the future the pair may continue forming the wave (b) or (x), which is taking the form of the double zigzag.
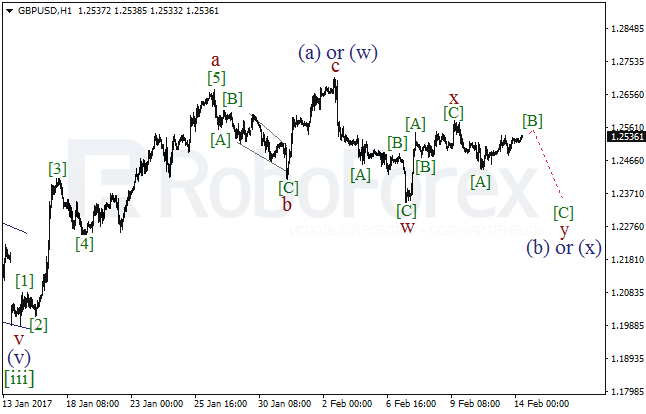
As we can see at the H1 chart, the pair is probably forming the zigzag in the wave y. Earlier, the price completed the ascending zigzag in the wave x. As a result, during the next several days the market may start a short-term decline towards the local low.
USD JPY, “US Dollar vs Japanese Yen”
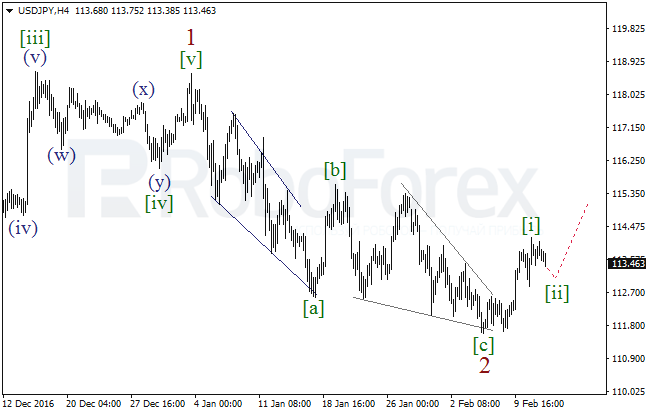
Probably, after finishing the wave 2 in the form of the zigzag with the diagonal triangle[c] inside it, the USD/JPY pair completed the bullish impulse in the wave [i]. Consequently, after finishing the local correction, the market is expected to continue moving upwards.
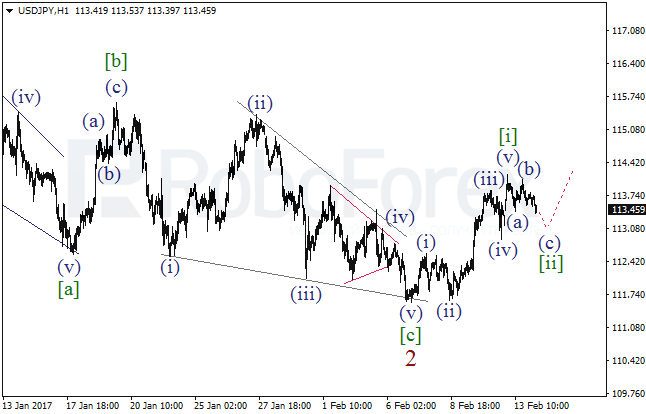
More detailed structure is shown on the H1 chart. Yesterday, the pair completed the wave (v) of [i]. Possibly, the wave [ii] is taking the form of the zigzag. After finishing the wave (c) of [ii], the market is expected to resume its growth.
AUD USD, “Australian Dollar vs US Dollar”
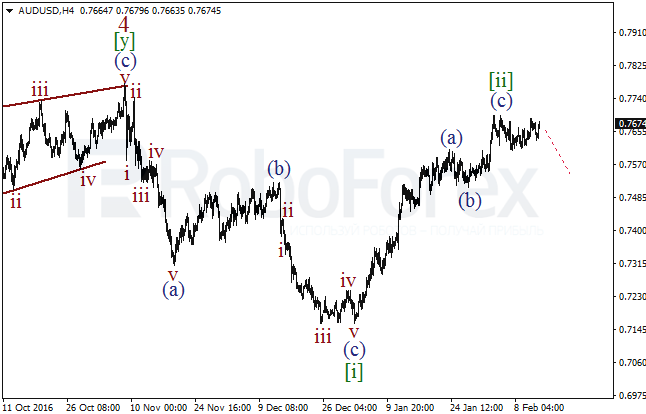
In case of the AUD/USD pair, the main scenario remains bearish. Probably, the price completed the zigzag[ii] of the diagonal triangle in the wave 5. Later, the market may resume falling in the wave [iii] of 5.
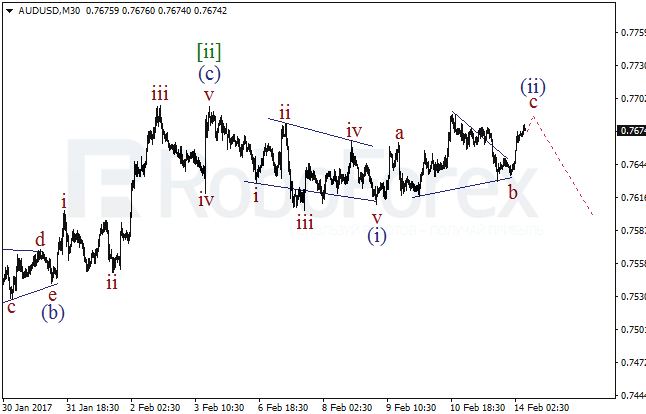
As we can see at the M30 chart, the pair formed the triangle b in the wave (ii). As a result, after finishing the wave c of [ii], the price may start falling in the third wave.
RoboForex Analytical Department
Forecasts presented in this section only reflect the author’s private opinion and should not be considered as guidance for trading. RoboForex bears no responsibility for trading results based on trading recommendations described in these analytical reviews.