Fibonacci Retracements Analysis 15.11.2017 (GBP/USD, EUR/JPY)
GBP USD, “Great Britain Pound vs US Dollar”
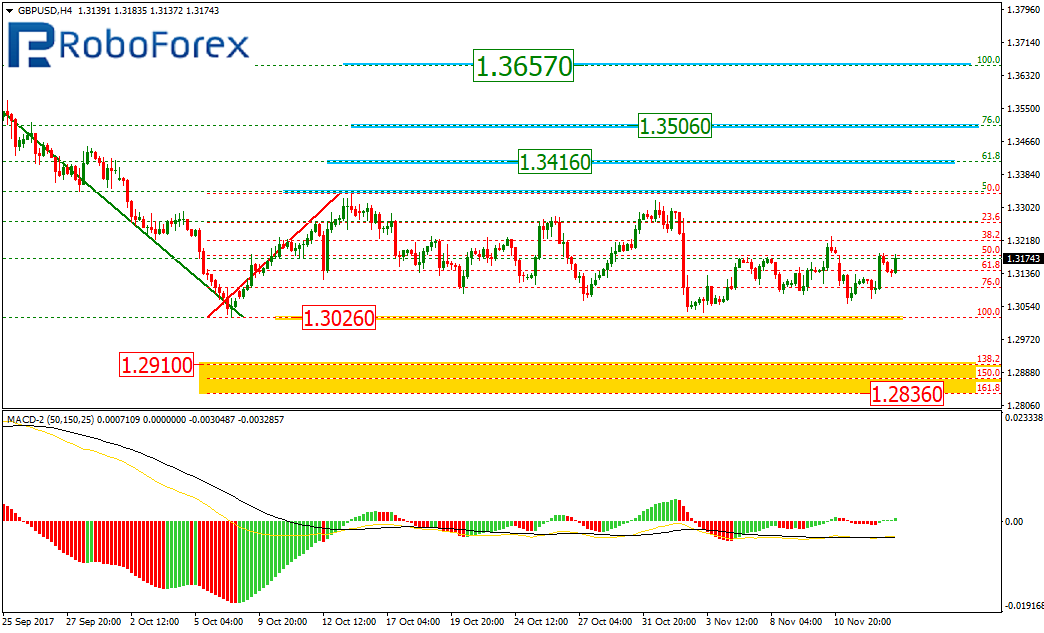
As we can see at the H4 chart, the GBP/USD pair is still being corrected inside the mid-term flat and has already reached the retracement of 50.0%. In the future, the correction may continue both upwards and downwards. The upside targets are the retracement of 61.8% and 76.0% at 1.3416 and 1.3506. And if the price breaks the low at 1.3026, the instrument may fall towards the post-correctional extension area between the retracements of 138.2% and 161.8% at 1.2910 and 1.2836 respectively. The resistance level is at 1.3657.
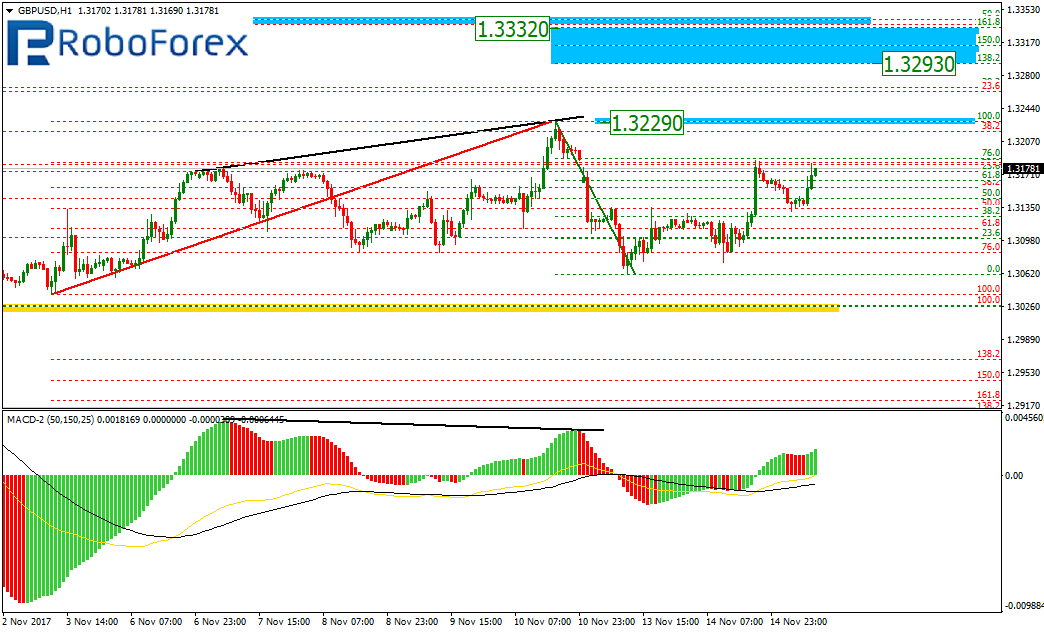
At the H1 chart, the pair is forming an ascending impulse. The closest target of the current uptrend is the local high at 1.3229. If the price breaks it, the instrument may move towards the post-correctional extension area between the retracements of 138.2% and 161.8% at 1.3293 and 1.3332 respectively.
EUR JPY, “Euro vs. Japanese Yen”
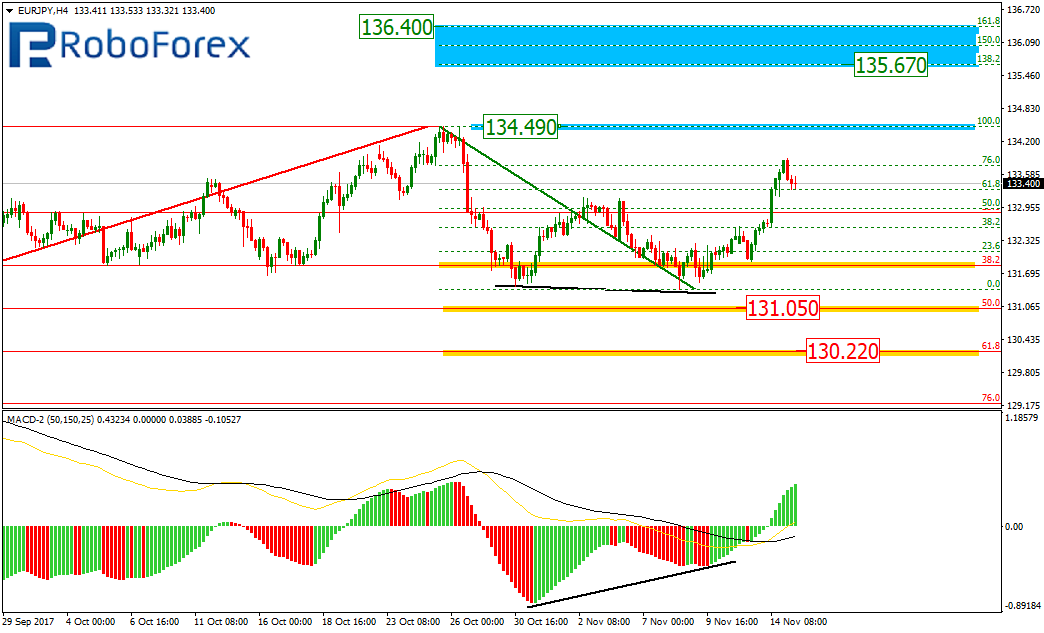
As we can see at the H4 chart, the EUR/JPY pair is forming an ascending impulse, which may break the local high at 134.49 and reach the post-correctional extension area between the retracements of 138.2% and 161.8% at 135.67 and 136.40 respectively.
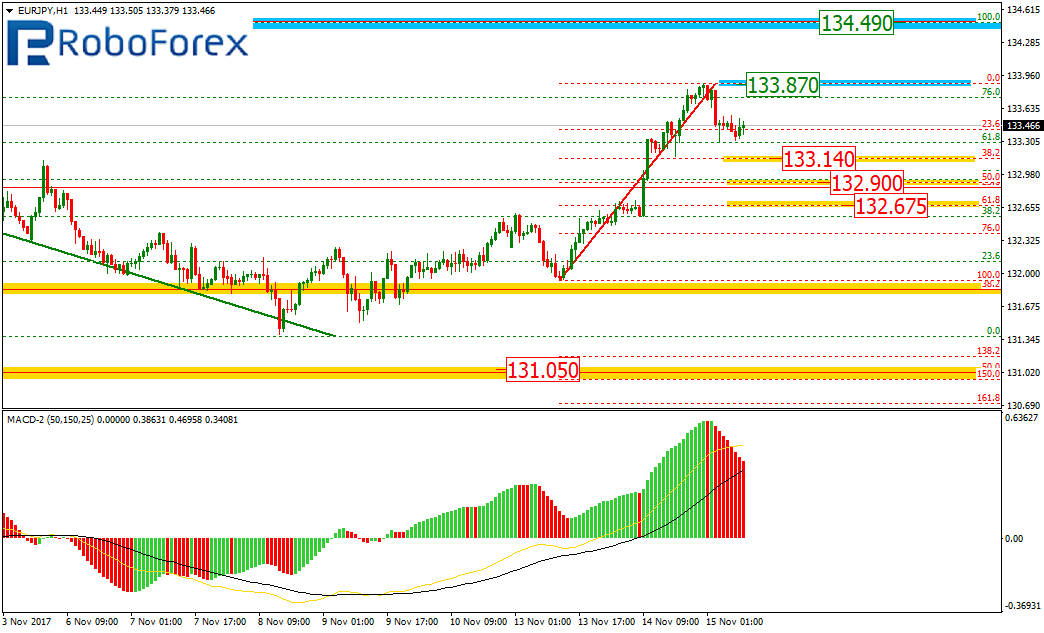
At the H1 chart, the current uptrend may transform into a new correction. The main targets of this correction may be the retracements of 38.2%, 50.0%, and 61.8% at 133.14, 132.90, and 132.67 respectively.
RoboForex Analytical Department
Forecasts presented in this section only reflect the author’s private opinion and should not be considered as guidance for trading. RoboForex bears no responsibility for trading results based on trading recommendations described in these analytical reviews.