Fibonacci Retracements Analysis 12.02.2020 (GBPUSD, EURJPY)
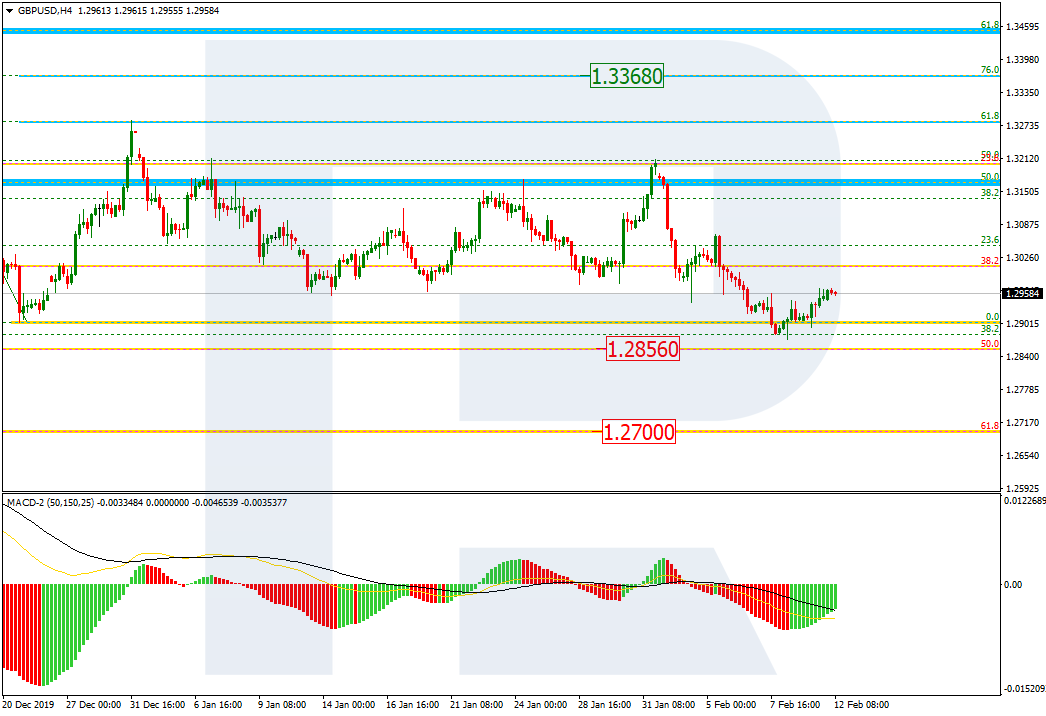
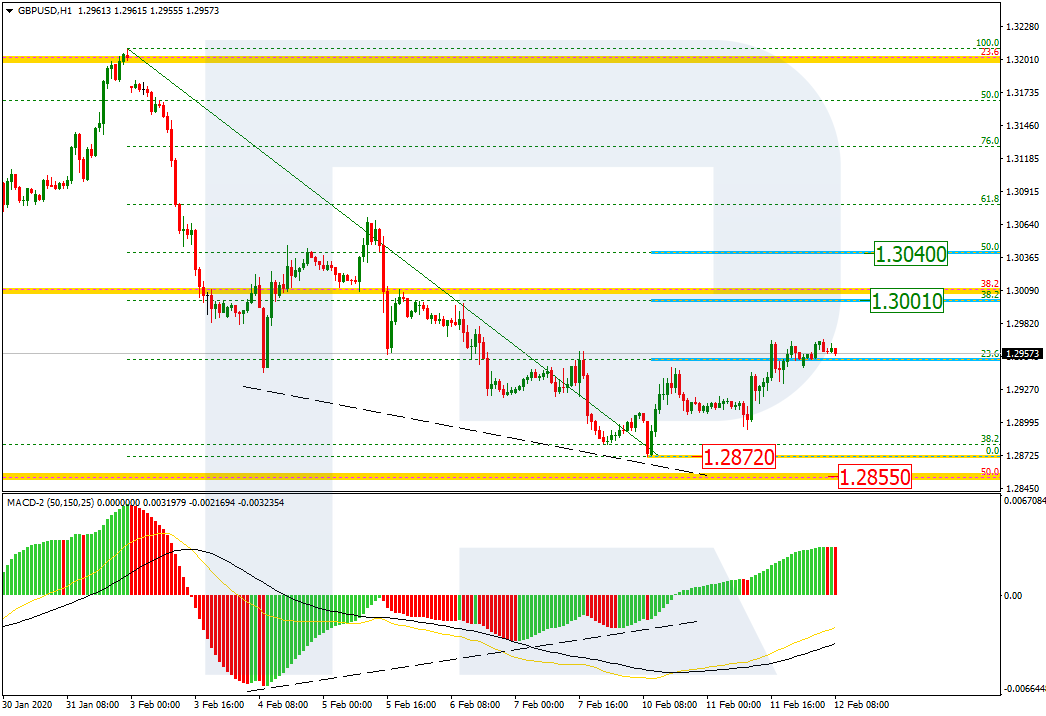
GBPUSD, “Great Britain Pound vs US Dollar”
As we can see in the H4 chart, GBPUSD has tested the previous low, thus indicating that the price may continue falling towards 50.0% and 61.8% fibo at 1.2856 and 1.2700 respectively. in the nearest future, the instrument is expected to form a new correction to the upside.

The H1 chart shows a rising correction after the convergence on MACD. By now, it has already reached 23.6% fibo and may continue growing towards 38.2% and 50.0% fibo at 1.3001 and 1.3040 respectively. The support is the low at 1.2872.
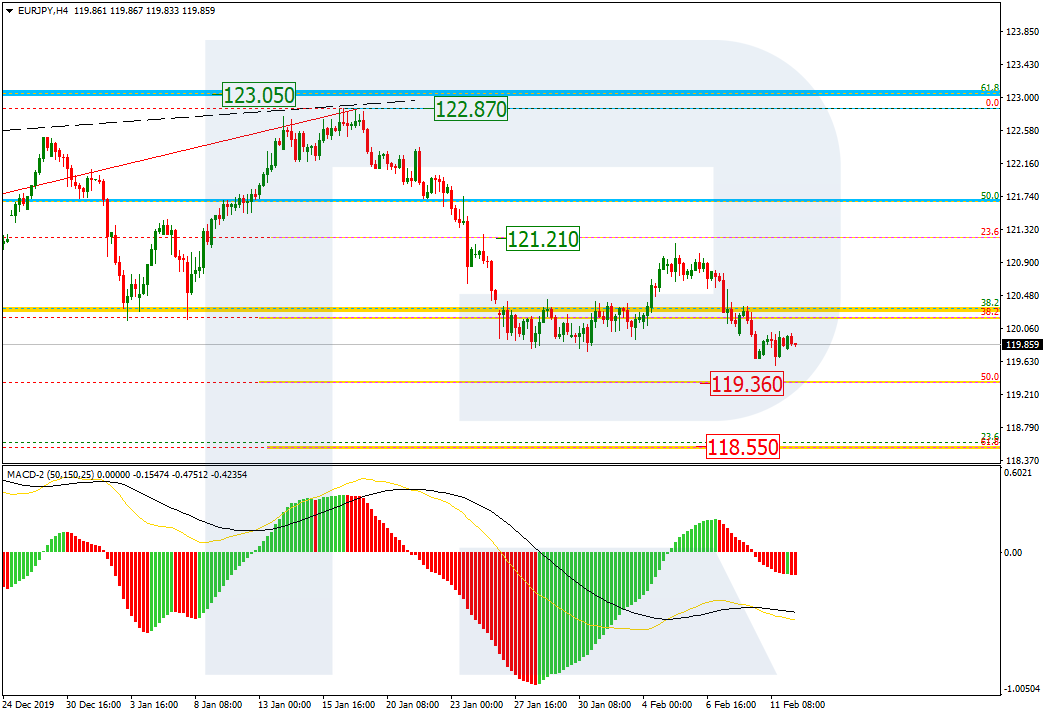
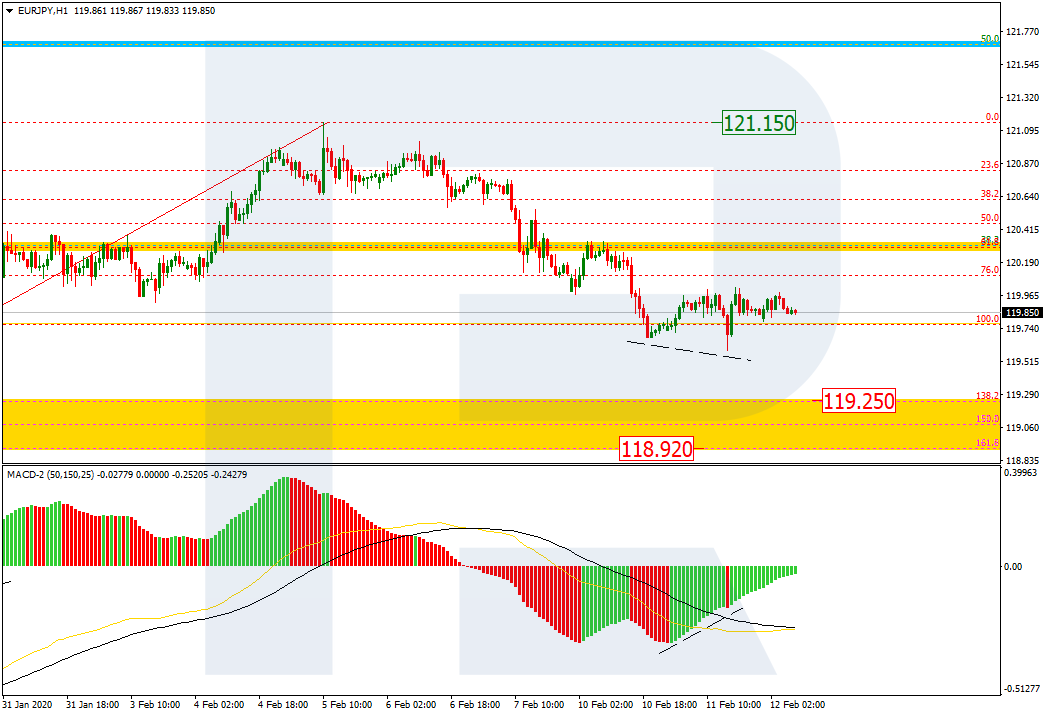
EURJPY, “Euro vs. Japanese Yen”
As we can see in the H4 chart, after finishing a pullback towards the resistance at 121.21, EURJPY is forming a new descending impulse, which has already updated the low. Later, the current decline may continue towards 50.0% and 61.8% fibo at 119.36 and 118.55 respectively.
The H1 chart shows a new correction to the upside after the convergence on MACD. After finishing the correction, the instrument may resume falling to reach the post-correctional extension area between 138.2% and 161.8% fibo at 191.25 and 118.92 respectively.
Forecasts presented in this section only reflect the author’s private opinion and should not be considered as guidance for trading. RoboForex bears no responsibility for trading results based on trading recommendations described in these analytical reviews.