Fibonacci Retracements Analysis 16.10.2018 (EURUSD, USDJPY)
EURUSD, “Euro vs US Dollar”
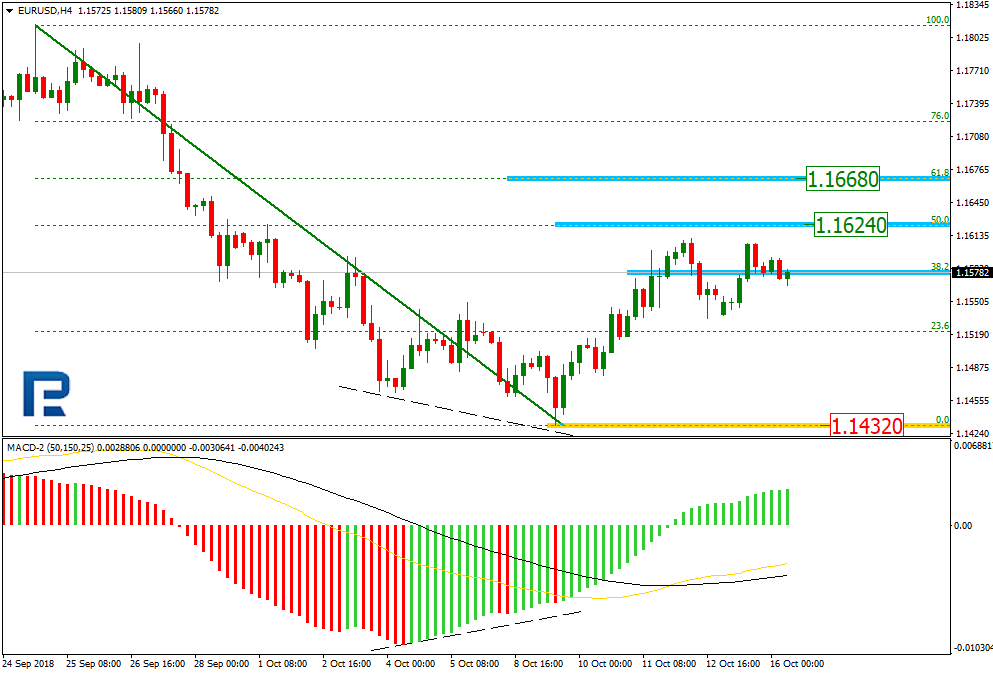
In the H4 chart, the uptrend continues; it has already reached the retracement of 38.2%. The next possible targets may be the retracements of 50.0% and 61.8% at 1.1624 and 1.1668 respectively. The support level is the low at 1.1432.

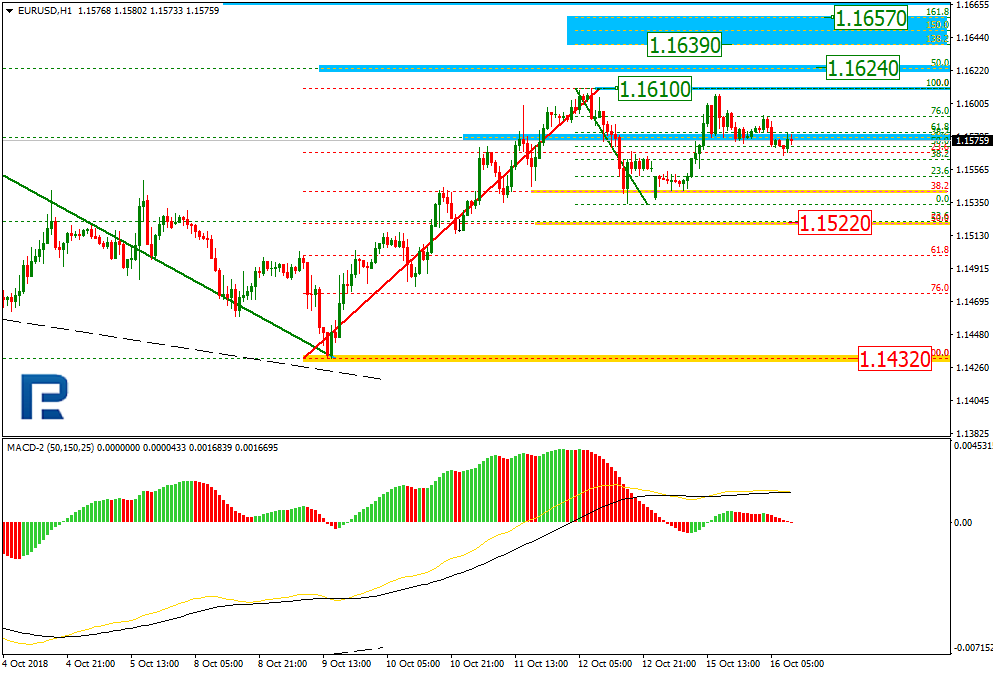
As we can see in the H1 chart, EURUSD is about to complete the current short-term correction and may later break the high at 1.1610. After that, the price may continue trading towards the post-correctional extension area between the retracements of 138.2% and 161.8% at 1.1639 and 1.1657 respectively. In case the correction continues, the next downside target the retracement of 50.0% at 1.1522.
USDJPY, “US Dollar vs. Japanese Yen”
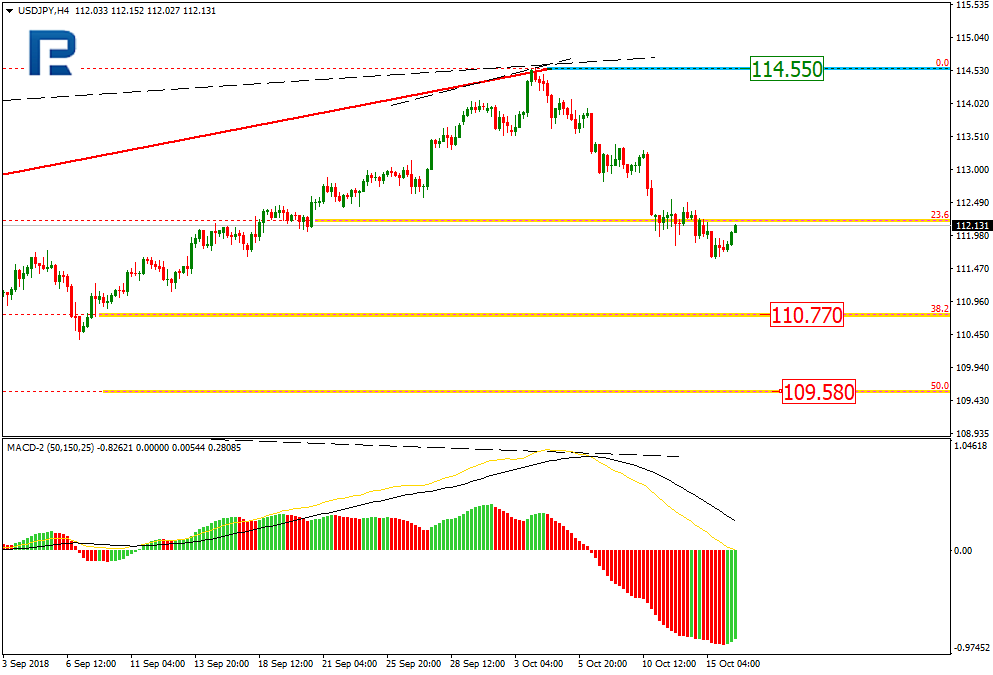
As we can see in the H4 chart, the divergence made USDJPY reverse and start a new correction to the downside, which has already reached the retracement of 23.6%. The next targets may be the retracements of 38.2% and 50.0% at 110.77 and 109.58 respectively. The main resistance level is the high at 114.55.
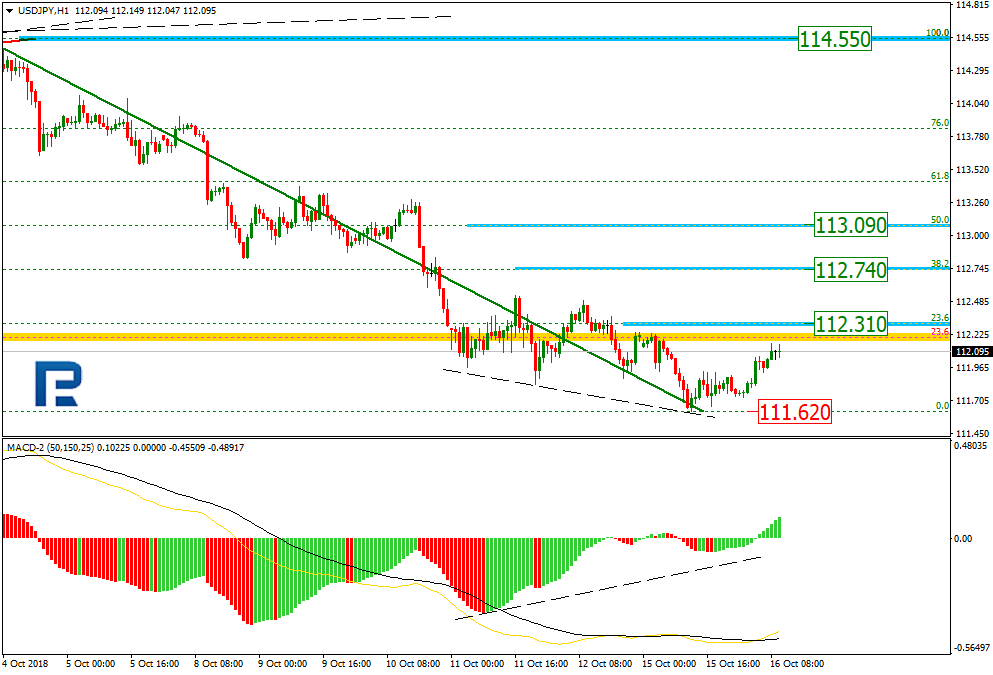
In the H1 chart, the convergence made the pair start a new short-term pullback. The possible targets are the retracements of 23.6%, 38.2%, and 50.0% at 112.31, 112.74, and 113.09 respectively. The support level is the low at 111.62.
Forecasts presented in this section only reflect the author’s private opinion and should not be considered as guidance for trading. RoboForex bears no responsibility for trading results based on trading recommendations described in these analytical reviews.