Fibonacci Retracements Analysis 22.08.2019 (AUDUSD, USDCAD)
AUDUSD, “Australian Dollar vs US Dollar”
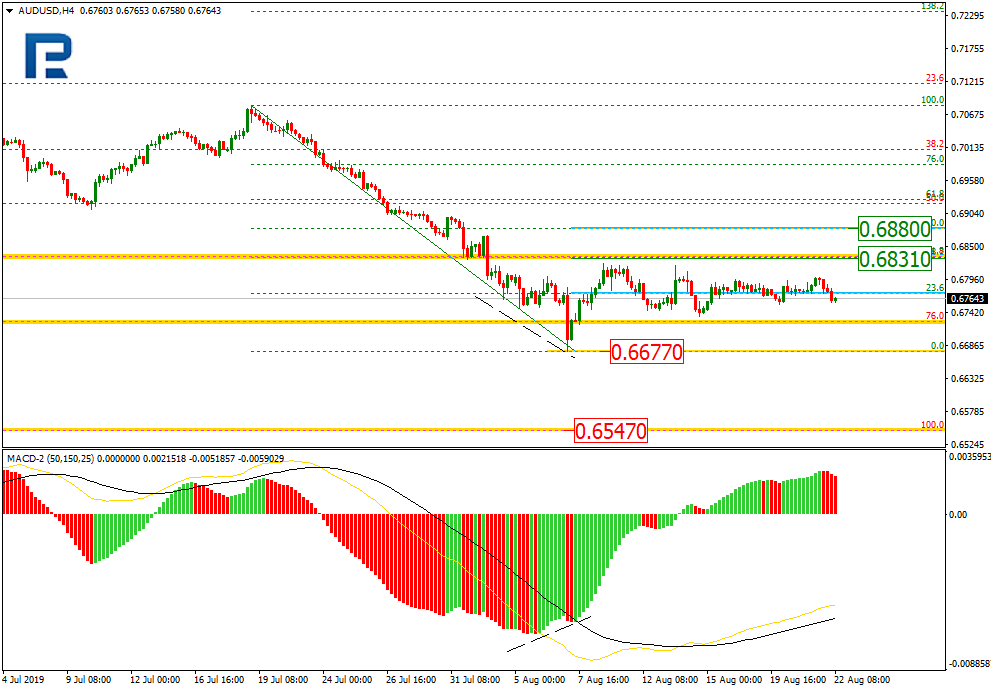
As we can see in the H4 chart, the convergence made AUDUSD start a new pullback, which was very close to 38.2% fibo at 0.6831 several times, but hasn’t reached it yet. Right now, the pair consolidating. As it is known, the longer the consolidation, the stronger the breakout of the range. That’s why, after breaking this level, the pair may quickly reach 50.0% fibo at 0.6880. When the correction is over, the instrument is expected to break the local support at 0.6677 and then continue falling to reach the long-term low at 0.6547.

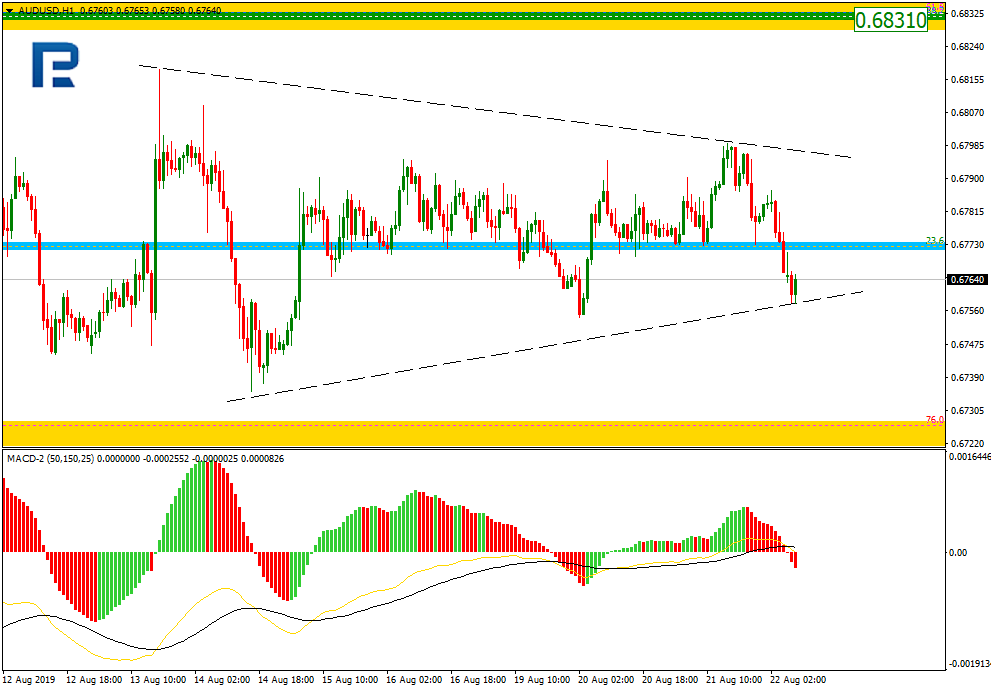
The H1 chart shows more detailed structure of the current consolidating channel. AUDUSD is trading close to 23.6% fibo.
USDCAD, “US Dollar vs Canadian Dollar”
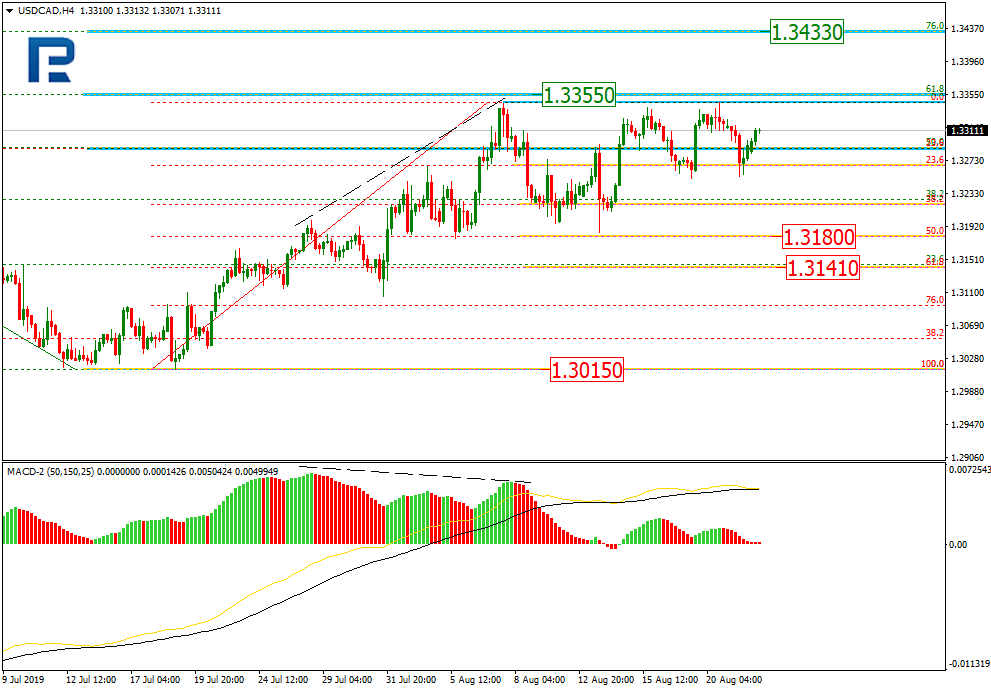
As we can see in the H4 chart, after reaching 50.0% fibo at 1.3180, USDCAD has rebounded towards the high. If the pair breaks it, the price may continue trading to reach mid-term 61.8% and 76.0% fibo at 1.3355 and 1.3433 respectively. Otherwise, the instrument may resume falling towards 50.0%, 61.8%, and 76.0% fibo at 1.3180, 1.3141, and 1.3095 respectively.
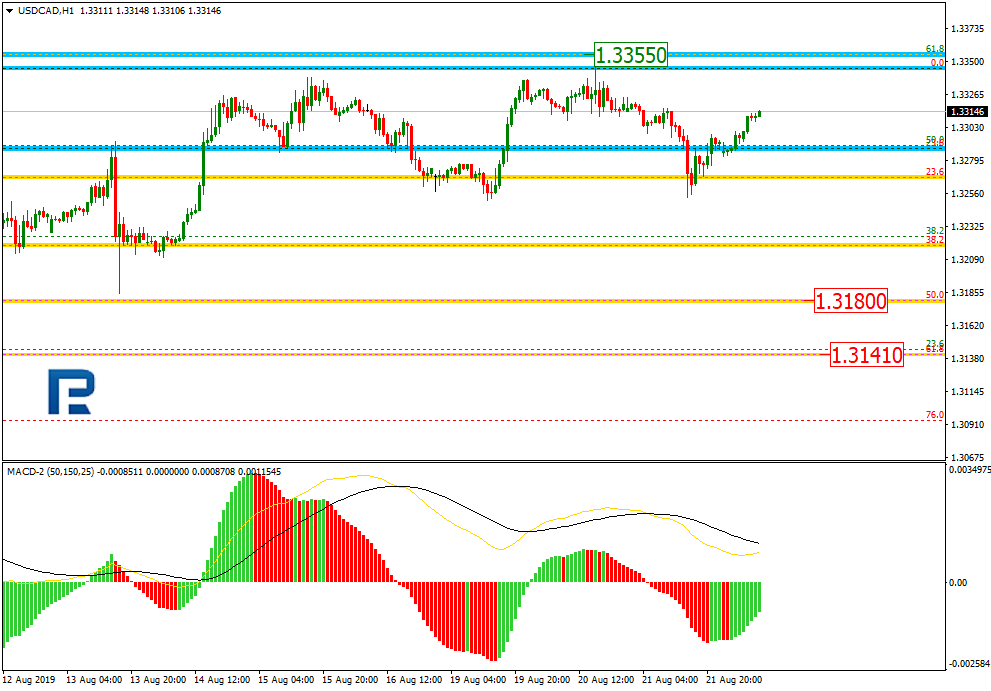
In the H1 chart, USDCAD is forming a new pullback after testing the high.
Forecasts presented in this section only reflect the author’s private opinion and should not be considered as guidance for trading. RoboForex bears no responsibility for trading results based on trading recommendations described in these analytical reviews.