Fibonacci Retracements Analysis 24.09.2020 (AUDUSD, USDCAD)
AUDUSD, “Australian Dollar vs US Dollar”
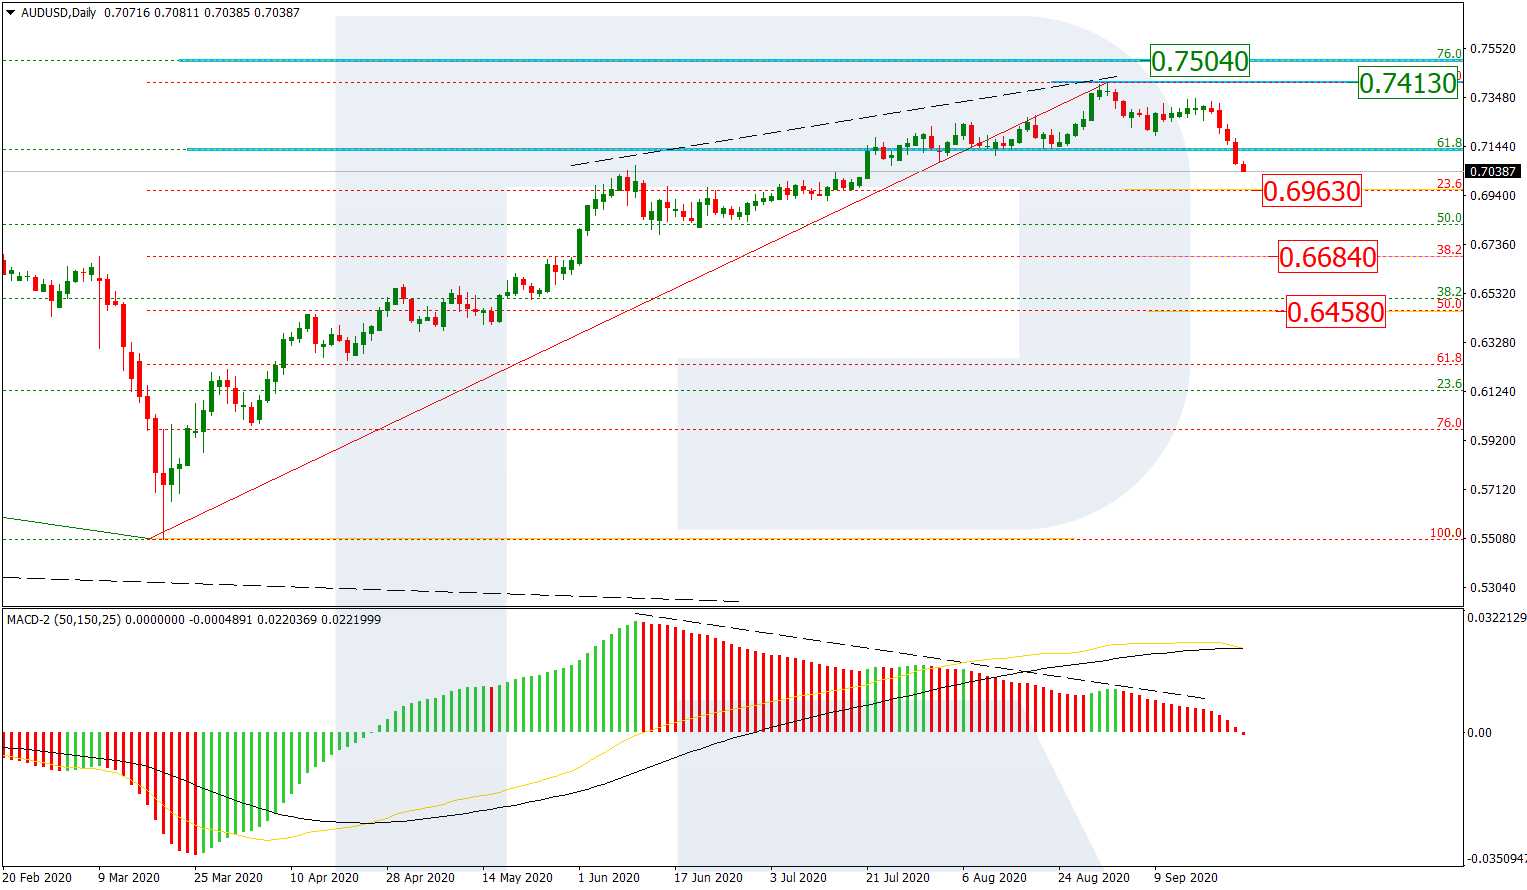
In the daily chart, the divergence on MACD made the pair stop growing between 61.8% and 76.0% fibo at 0.7130 and 0.7504 respectively and start a new descending tendency. The current high, which is the resistance here, is at 0.7413, while the first downside target is at 23.6% fibo (0.6963). After reaching and breaking it, AUDUSD may continue falling towards 38.2% and 50.0% fibo at 0.6684 and 0.6458 respectively.

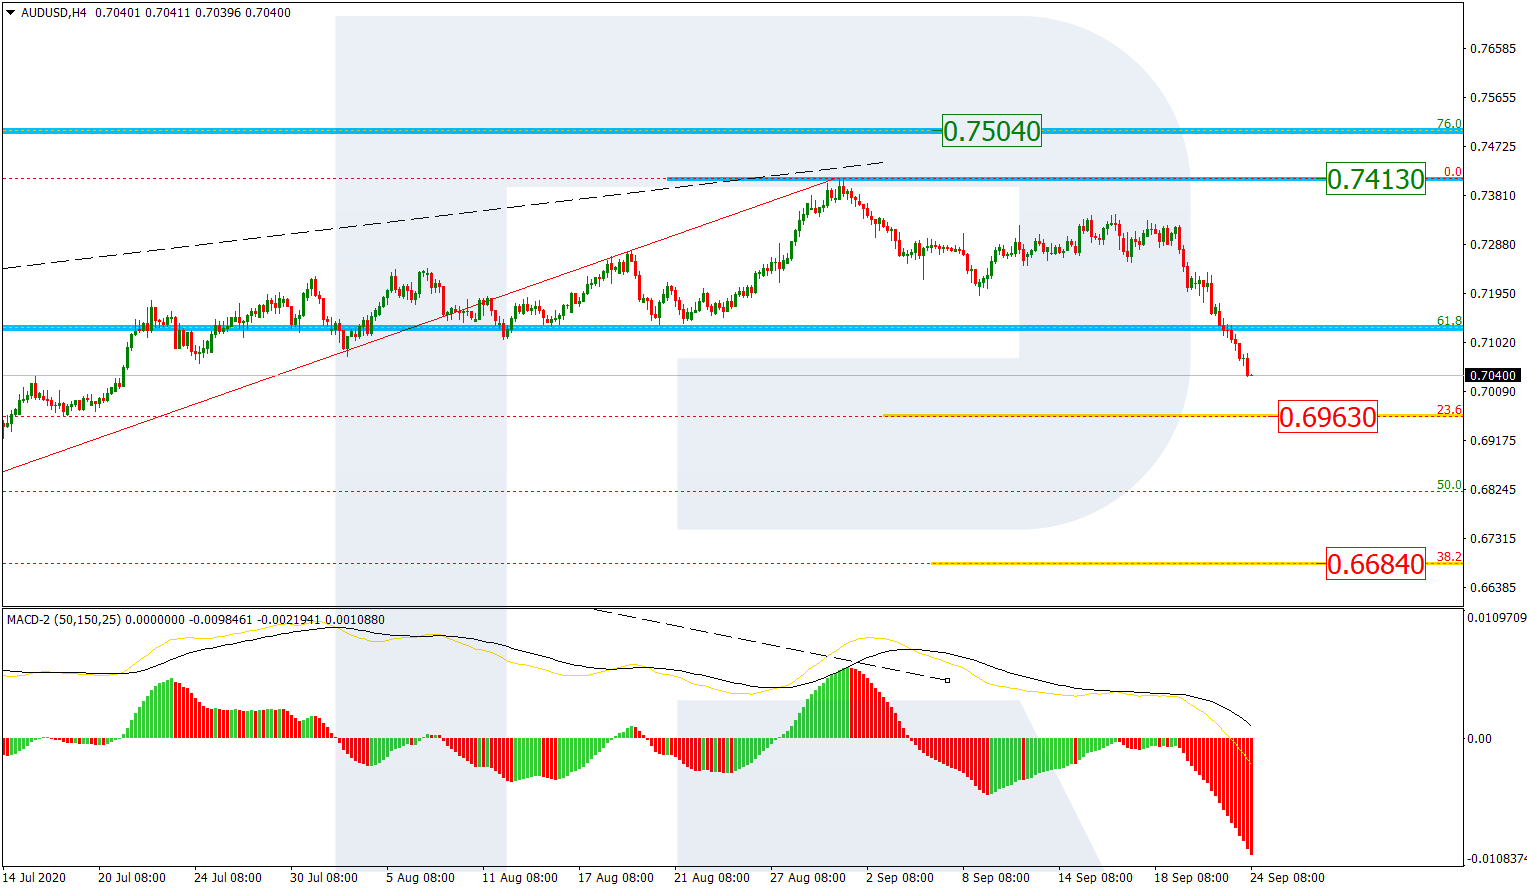
As we can see in the H4, the asset is steadily falling towards 23.6% fibo at 0.6963. The current downtrend is looking pretty stable and fast but one shouldn’t exclude a pullback from the first target.
USDCAD, “US Dollar vs Canadian Dollar”
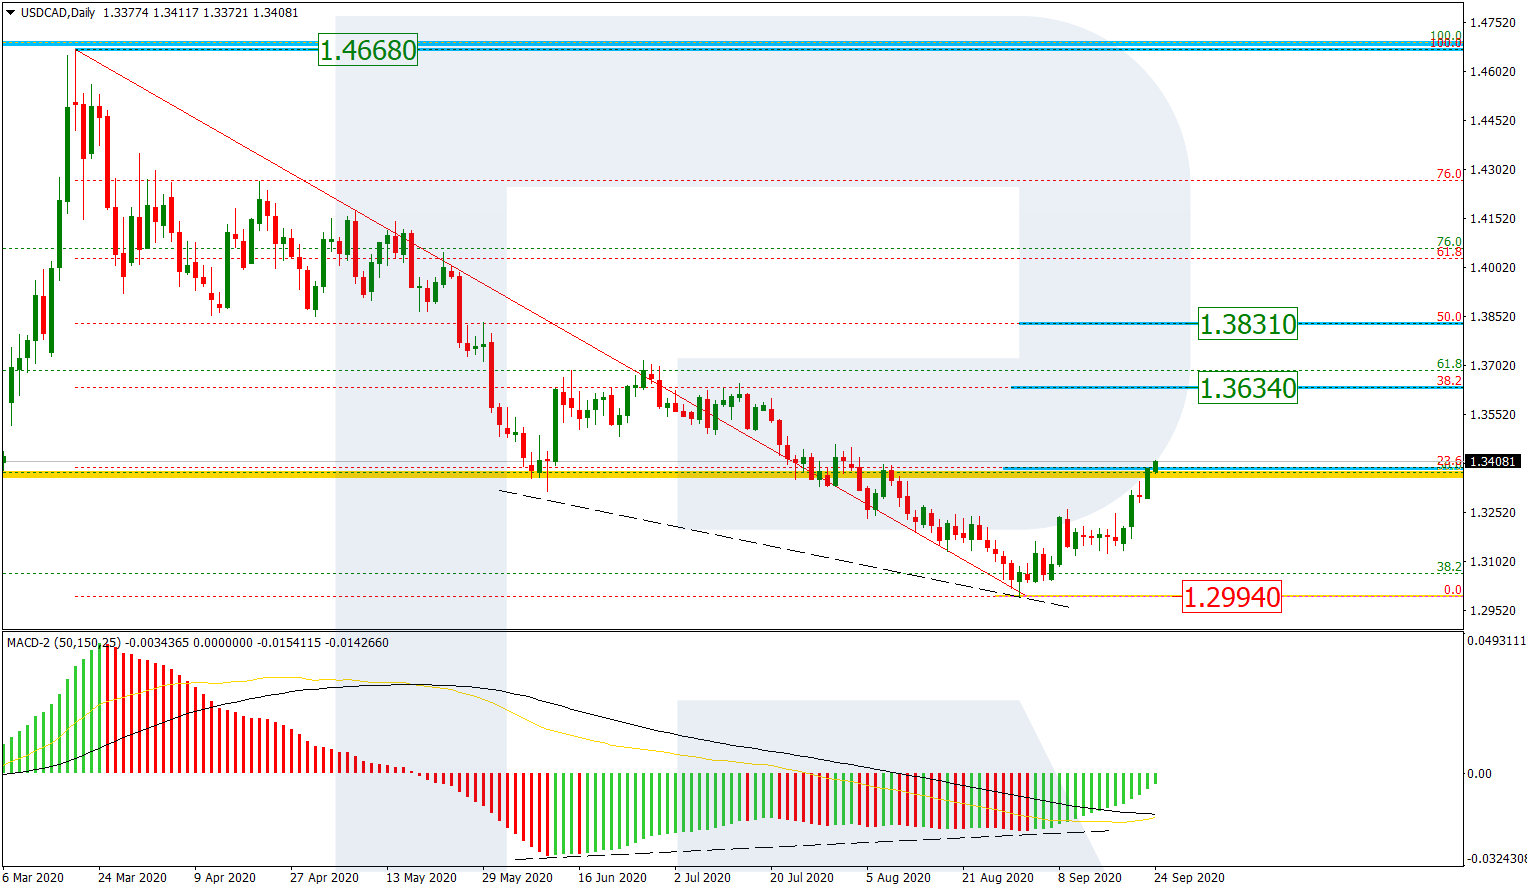
As we can see in the daily chart, the convergence on MACD made the pair start a new correction to the upside, which has already reached 23.6% fibo and right now is testing it. The next targets are 38.2% and 50.0% fibo at 1.3634 and 1.3831 respectively. The support is the fractal low at 1.2994.
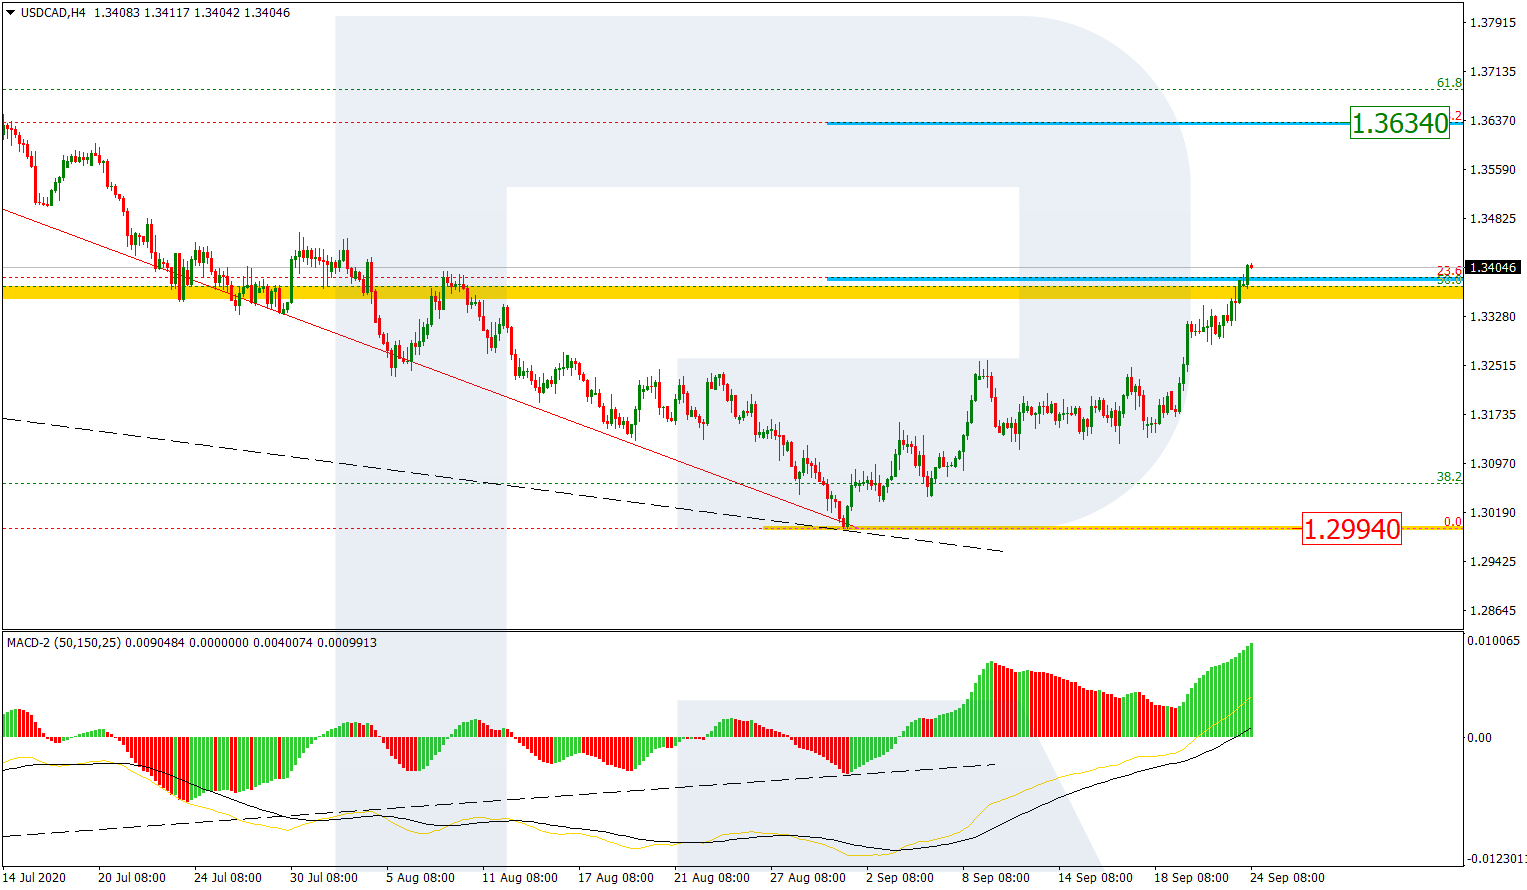
The H4 chart shows a more detailed structure of the current uptrend. The pair is trying to break 23.6% fibo. The ascending wave is quite stable and may soon reach 38.2% fibo at 1.3634.
Forecasts presented in this section only reflect the author’s private opinion and should not be considered as guidance for trading. RoboForex bears no responsibility for trading results based on trading recommendations described in these analytical reviews.