Forex Technical Analysis 2010/11/23. Euro Index, GBP/USD, EUR/JPY, GBP/CHF Forecast FX.
Euro Index Forecast Nov 24 2010
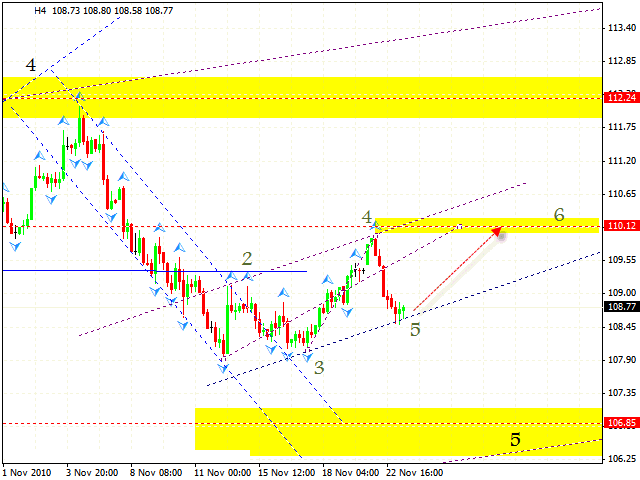
The EUR/USD currency pair is being corrected, however, at the moment the Euro Index is forming the rising pattern with the target in the area of 110.12. The formation of this pattern can result in the growth of the pair. In case the rising channel at Euro Index is broken, we should expect the rate to fall to the level of 106.85 where we can consider buying the pair during a long-term period.
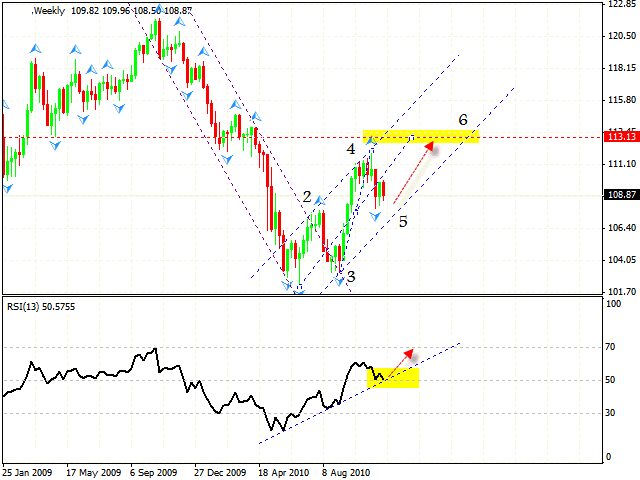
The weekly online forex trading chart indicates that the Index will continue to grow. The RSI indicator is testing the rising trend’s line, which, in this case, is a support line. Thus we can expect the development of the rising trend with the target in the area of 113.
GBP USD Forecast Nov 24 2010
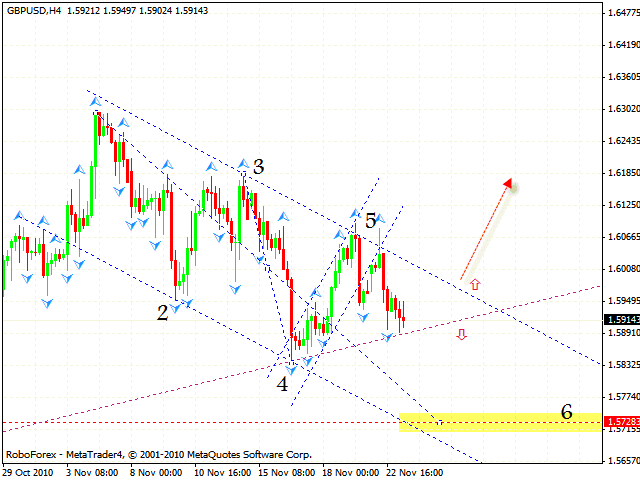
Pound wasn’t able to fix itself above the channel’s border. According to gbpusd forecast at the moment we have two different possible scenarios. The first one is the following: in case the channel’s lower border is broken, we can expect the pair to fall into the area of 1.5728. The descending symmetrical pattern is being formed in this area. However, one should take into account the fact that there is a strong rising trend here. That’s why the second scenario is: in case the channel is broken upwards, one can try to buy the pair with the stop behind the closest maximum for a long-term period.
EUR JPY Forecast Nov 24 2010
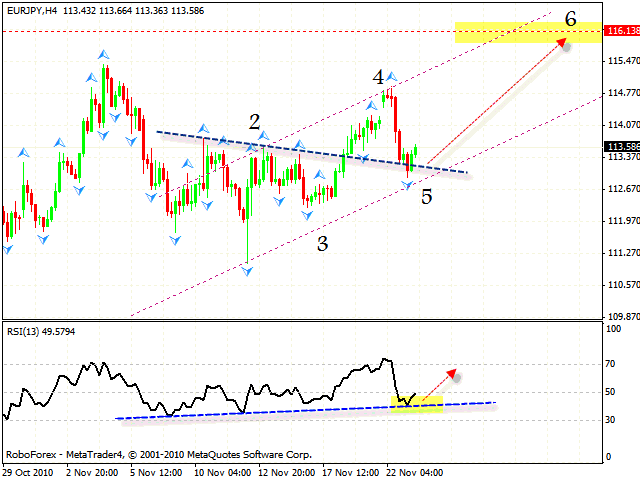
The price is testing the broken neckline, thus we should expect the pair to grow. The RSI indicator was supported by the trend line, indicating a possible rising movement. We also have the rising pattern with the target in the area of 116.13. Judging by eur jpy analysis you can try to buy the pair with the tight stop. If the price breaks the rising channel, one is recommended to close long positions.
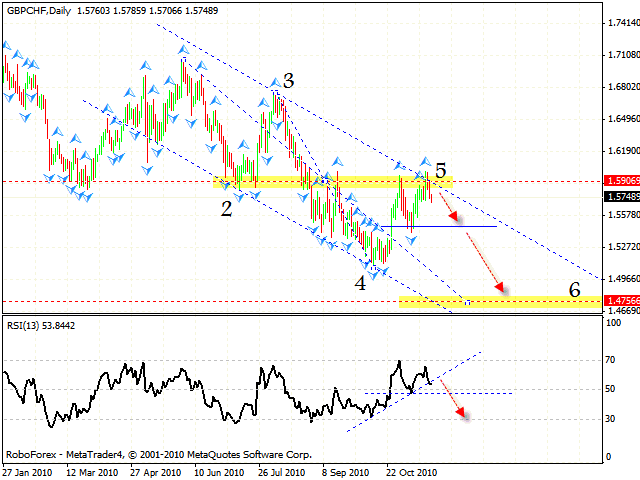
GBP CHF Forecast Nov 24 2010
Now let’s discuss the situation with the GBP/CHF currency pair. Gbp chf analysis shows the formation of the 5th point of reference of the descending pattern with the target in the area of 1.4755. The daily chart shows us a divergenceat the RSI indicator, which is a signal to sell the pair. At the RSI indicator we can also see that the trend line is broken. In case the support line is broken, the GBP/CHF currency pair will fall to this support level at the price chart.
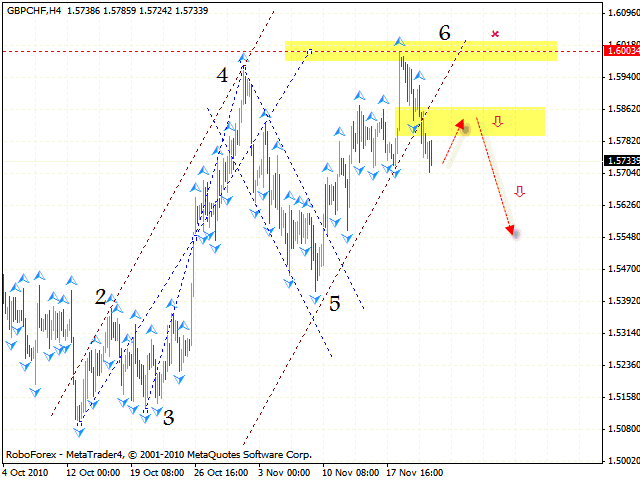
At the H4 chart we can see the rising pattern with the target of 1.6000 that has been completed. By the moment the price has broken the rising channel thus defining an area to sell the pair. The stop in this case must be above local maximum. There is a possibility that “head & shoulders” reversal pattern will be formed; if it happens, we can consider selling the pair from the above-mentioned area. One shouldn’t increase the amount of short positions until the neckline is broken.
Forecasts presented in this section only reflect the author’s private opinion and should not be considered as guidance for trading. RoboForex bears no responsibility for trading results based on trading recommendations described in these analytical reviews.