XAU Technical Analysis, 10.10.2012. Medium Term Perspective.
10.10.2012
More than a month ago we analyzed the chart of Spot Gold. So, what has changed over this period? Let’s take a look at the weekly chart (Fig. 1).
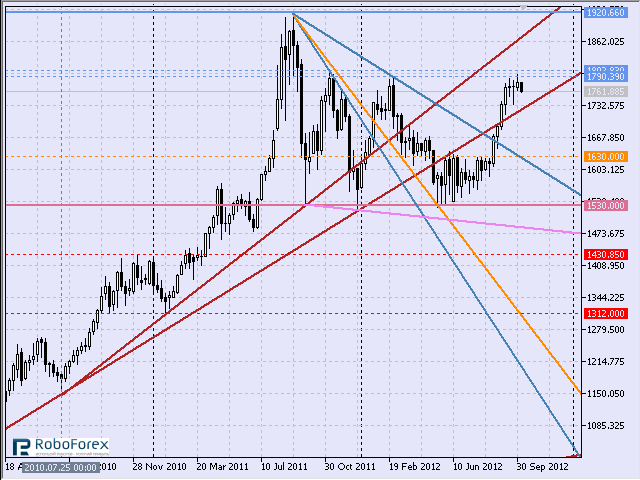
Fig. 1 Spot Gold (XAU), weekly time frame
For the second time over the last year the pair has reached the level of 1790.30, but hasn’t been able to break it. This level is quite a strong one. There is a possibility that the price may form reversal patterns at shorter time frames. Now let’s look at the daily chart (Fig. 2).
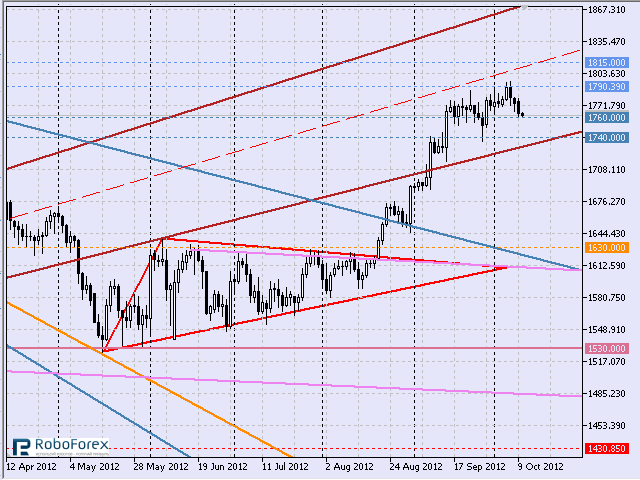
Fig. 2 Spot Gold (XAU), daily time frame
Right now Gold is moving between the speed lines. Also, there are horizontal static resistance & support levels from above and below respectively. Well, I think it will be more conservative and better to wait for something which is more distinct. A good point to enter the market is a cluster near the level of 1740.30. If the price doesn’t fall down lower, we can expect the instrument to test the annual maximum again in the mid-term.
RoboForex Analytical Department
Fig. 1 Spot Gold (XAU), weekly time frame
For the second time over the last year the pair has reached the level of 1790.30, but hasn’t been able to break it. This level is quite a strong one. There is a possibility that the price may form reversal patterns at shorter time frames. Now let’s look at the daily chart (Fig. 2).
Fig. 2 Spot Gold (XAU), daily time frame
Right now Gold is moving between the speed lines. Also, there are horizontal static resistance & support levels from above and below respectively. Well, I think it will be more conservative and better to wait for something which is more distinct. A good point to enter the market is a cluster near the level of 1740.30. If the price doesn’t fall down lower, we can expect the instrument to test the annual maximum again in the mid-term.
RoboForex Analytical Department
Attention!
Forecasts presented in this section only reflect the author’s private opinion and should not be considered as guidance for trading. RoboForex bears no responsibility for trading results based on trading recommendations described in these analytical reviews.