RoboForex
Bill Williams’ Indicators Analysis 22.04.2013 (USD/CAD, NZD/USD)
22.04.2013Analysis for April 22nd, 2013
At the H4 chart of the USD/CAD currency pair, the Alligator is moving upwards. There is a Squat bar on the MFI; the indicators are in the grey zone (directed in different directions); the price forming a bearish fractal. I’m keeping my buy order opened with the target above a bullish fractal.
USD/CAD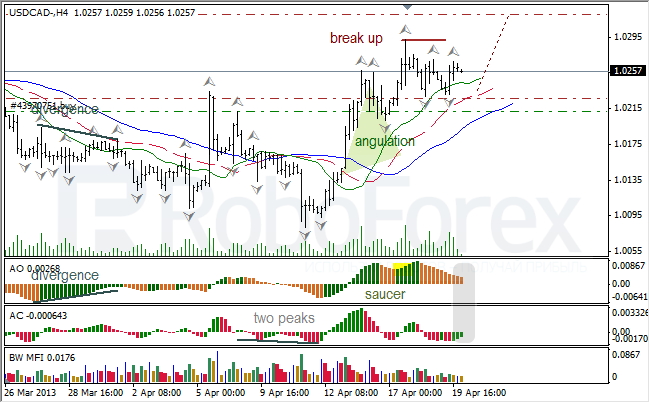
At the H1 chart of the USD/CAD currency pair, the Alligator is sleeping. The indicators are in the red zone; there is no activity on the MFI. If a new bearish fractal “touches” my protective stop, I’ll open a new buy order.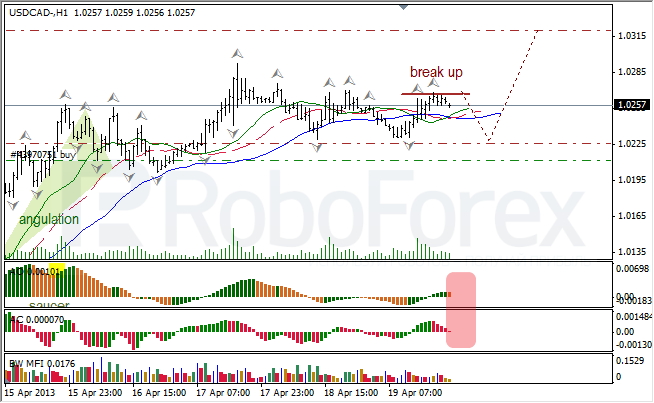
NZD/USD
At the H4 chart of the NZD/USD currency pair, the Alligator is moving downwards. AO and AC indicators are in the red zone; there is a Squat bar on the MFI; the price is forming a bearish fractal. I’ve opened a sell order with a protective stop above the Alligator’s jaw.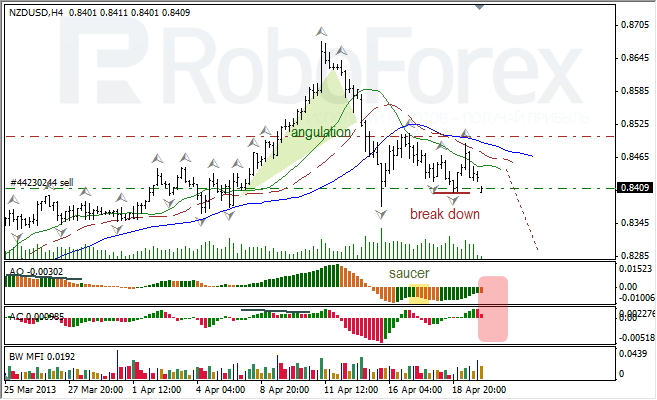
At the H1 chart of the NZD/USD currency pair, the Alligator is sleeping. The indicators are in the grey zone; there might be a Squat bar on the MFI, so one should be very attentive.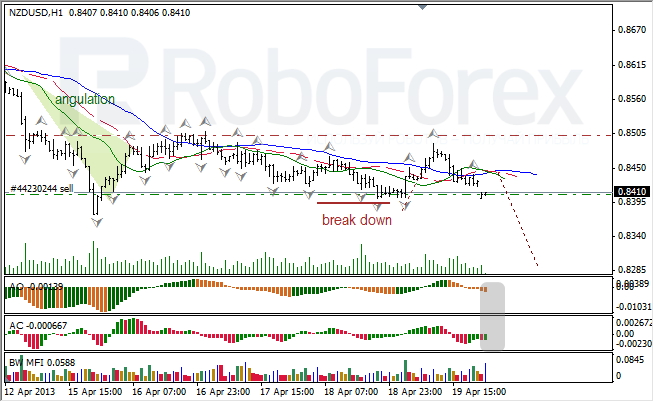
RoboForex Analytical DepartmentAttention!Forecasts presented in this section only reflect the author’s private opinion and should not be considered as guidance for trading. RoboForex bears no responsibility for trading results based on trading recommendations described in these analytical reviews.