Bill Williams’ Indicators Analysis 18.06.2013 (USD/CAD, NZD/USD)
18.06.2013
Analysis for June 18th, 2013
USD/CAD
At the H4 chart of the USD/CAD currency pair, the Alligator is closing its mouth. There is a divergence; the price is forming a bearish fractal; AO is near the balance line, AC is in the red zone; there is a Green bar on the MFI and might be a Squat one too. I’m planning to open some buy orders as soon as the price completes the bearish fractal.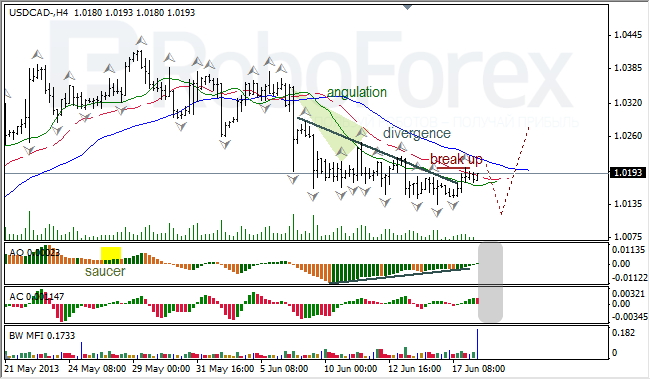
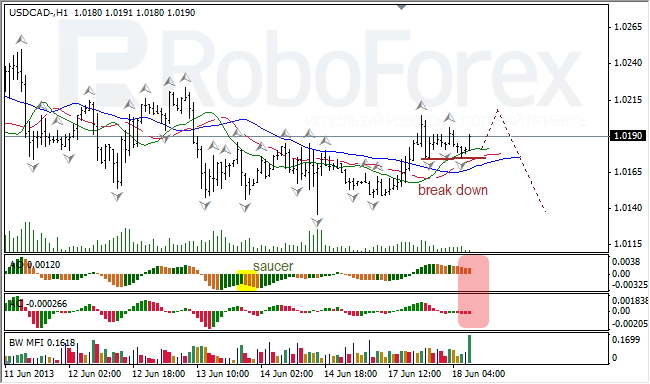
At the H1 chart of the USD/CAD currency pair, the Alligator is sleeping. The price is forming a bullish fractal; AO and AC indicators are in the red zone; there is a Squat bar on the MFI. I expect the price to complete the bullish fractal and then break the Alligator’s mouth.
NZD/USD
At the H4 chart of the NZD/USD currency pair, the Alligator is closing its mouth after making a reverse. The price formed a bearish fractal; the indicators are in the red zone; there might be a Squat bar on the MFI. I’m staying out of the market until the price forms a bullish fractal.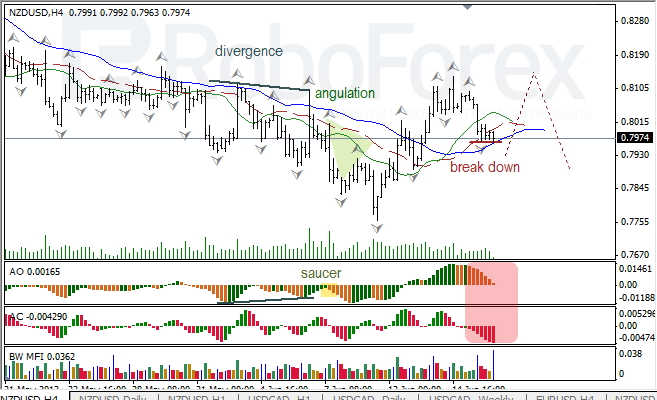
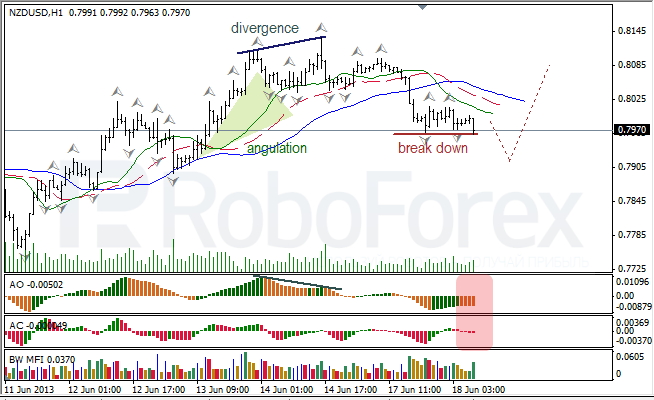
At the H1 chart of the NZD/USD currency pair, the Alligator is opening its mouth downwards slowly. AO is in the red zone, AC is very close to the balance line; there is a Green bar on the MFI and no Squat ones yet. I expect the price to start moving downwards.
RoboForex Analytical Department
Attention!
Forecasts presented in this section only reflect the author’s private opinion and should not be considered as guidance for trading. RoboForex bears no responsibility for trading results based on trading recommendations described in these analytical reviews.