Wave Analysis 16.01.2013 (DJIA Index, Crude Oil)
16.01.2013
Analysis for January 16th, 2013
DJIA Index
The current chart structure implies that the Index may have already completed wave [2] in the form of double zigzag pattern. On the minor wave level the price is finishing wave C. We can’t exclude a possibility that in the nearest future price may make a reverse and start falling down inside the first wave.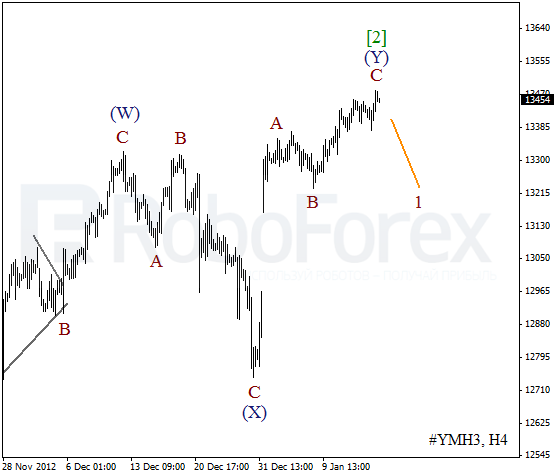
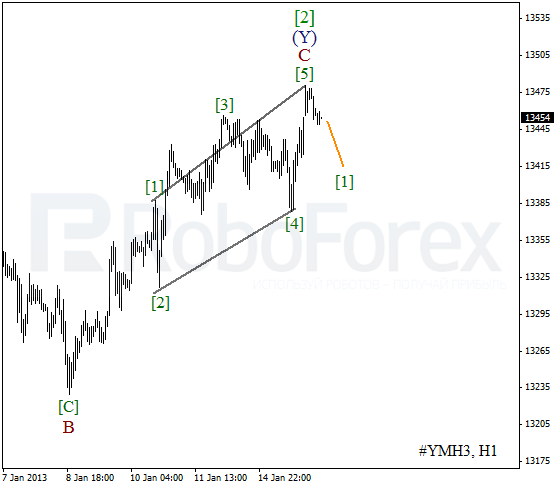
As we can see at the H1 chart, the Index is forming (or has already formed) diagonal triangle pattern inside wave C. Most likely, the instrument will continue falling down inside wave [1] during the day.
Crude Oil
It looks like the price is finishing an impulse inside wave(C, it pattern needs one more ascending wave to be completed. We can’t exclude a possibility that the instrument may break a local maximum during Wednesday and then make a reverse.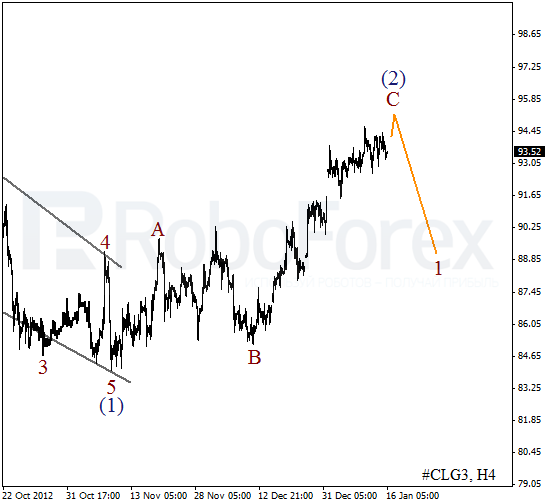
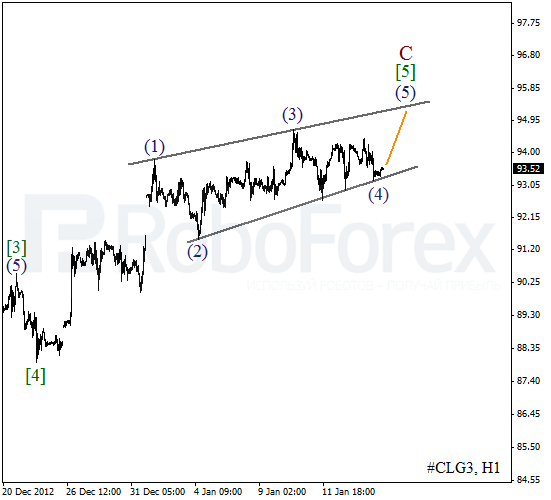
As we can see at the H1 chart, the instrument is forming diagonal triangle pattern. On the minor wave level the market finished the fourth wave. Most likely, in the nearest future the price will start moving upwards and forming wave (5) of [5].
RoboForex Analytical Department
Attention!
Forecasts presented in this section only reflect the author’s private opinion and should not be considered as guidance for trading. RoboForex bears no responsibility for trading results based on trading recommendations described in these analytical reviews.