Wave Analysis 12.04.2013 (DJIA Index, Crude Oil)
12.04.2013
Analysis for April 12th, 2013
DJIA Index
The Index is still moving upwards. It looks like the price is forming wave [5] of 5. The current wave structure implies that the instrument may continue growing up in the nearest future. The target for the bulls is the level of 15000.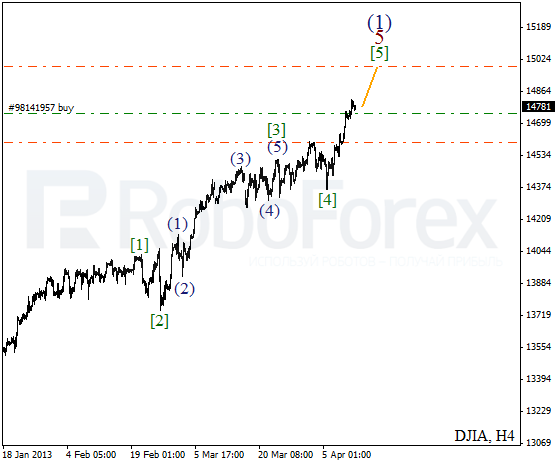
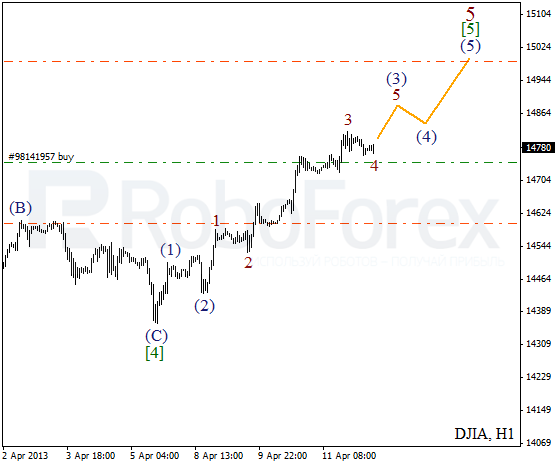
More detailed wave structure is shown on the H1 chart. It looks like the price is expanding wave (3). On the minor wave level, the market is completing the fourth wave and may start a new ascending movement inside the fifth one during the day.
Crude Oil
The instrument is still forming triangle pattern inside wave B. Yesterday the price started moving downwards again, so I decided to open a sell order. Most likely, the market will break a local minimum during the next several days.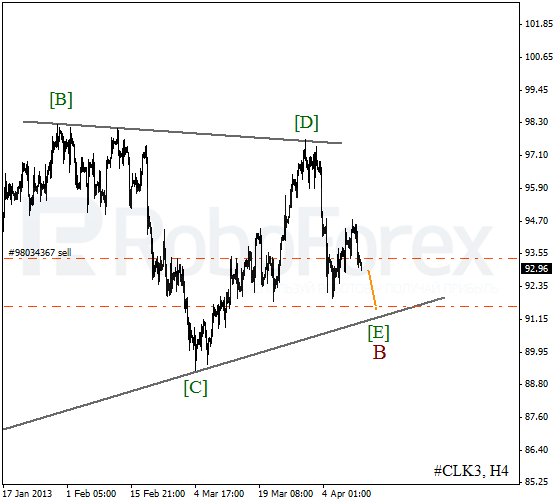
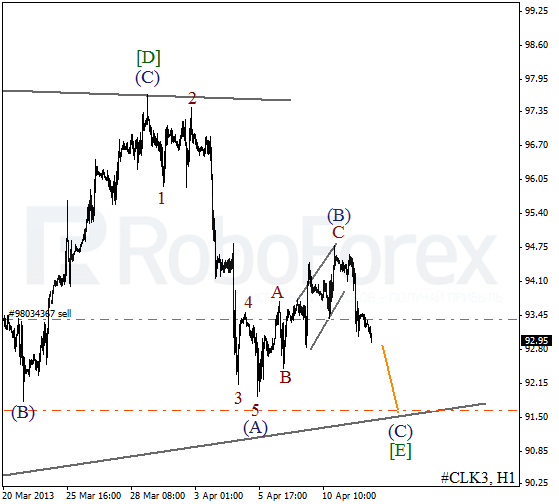
As we can see at the H1 chart, the current correction was completed with diagonal triangle pattern inside wave C of (4). During the next several days, the instrument may continue moving downwards. If Oil rebounds from the lower trend’s line, the price will start a new ascending movement.
RoboForex Analytical Department
Attention!
Forecasts presented in this section only reflect the author’s private opinion and should not be considered as guidance for trading. RoboForex bears no responsibility for trading results based on trading recommendations described in these analytical reviews.