Wave Analysis 30.04.2013 (DJIA Index, Crude Oil)
30.04.2013
Analysis for April 30th, 2013
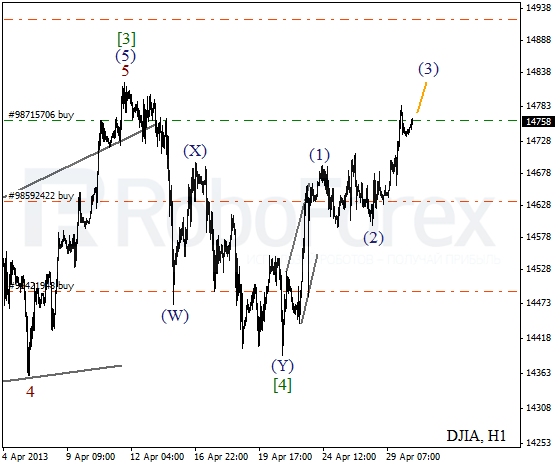
DJIA Index
Just as I expected, after completing the correction, the market continued growing up the fifth wave. Most likely, the Index will break the maximum during the next several days. The target for the bulls is still the level of 14950.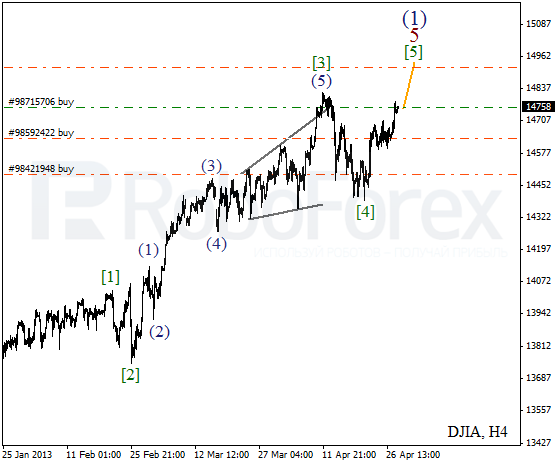
As we can see at the H1 chart, the fourth wave was completed in the form of double zigzag pattern. Later the market formed an initial wedge pattern inside wave (1) and right now it moving upwards inside wave (3). During a local correction, I opened one more buy order.
Crude Oil
It looks like Oil is about to finish a correction inside wave [B]. Earlier the price completed a descending impulse inside wave [A]. In the near term, the instrument is expected to start falling down and form wave [C] of E.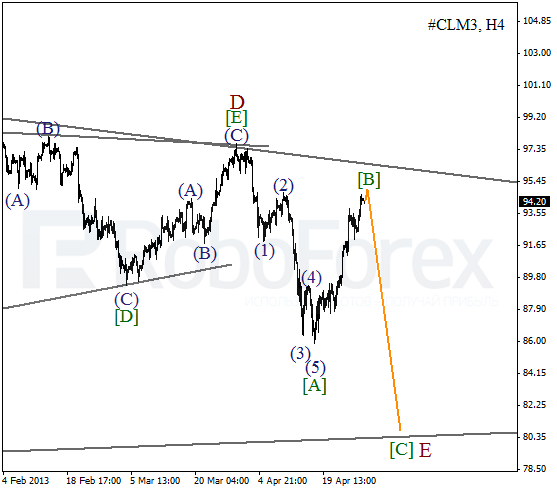
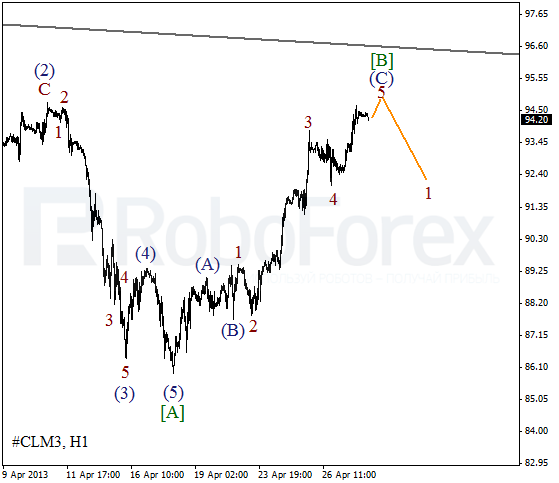
More detailed wave structure is shown on the H1 chart. We can see that wave [B] is taking the form of zigzag pattern. On the minor wave level, the price is forming the fifth wave (C), which lacks one more short wave in order to be completed. I’m planning to start selling only after the price forms a clear bearish impulse.
RoboForex Analytical Department
Attention!
Forecasts presented in this section only reflect the author’s private opinion and should not be considered as guidance for trading. RoboForex bears no responsibility for trading results based on trading recommendations described in these analytical reviews.