Wave Analysis 22.06.2012 (NZD/USD, EUR/USD)
22.06.2012
Analysis for June 22nd, 2012
NZD/USD
It looks like the price has completed zigzag pattern at the H4 chart and currently is forming an initial descending impulse. In the near term, we can expect the local correction to take place and then the price may start falling down in wave (3).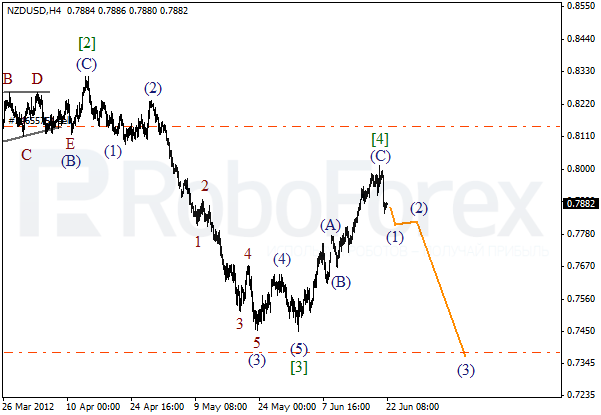
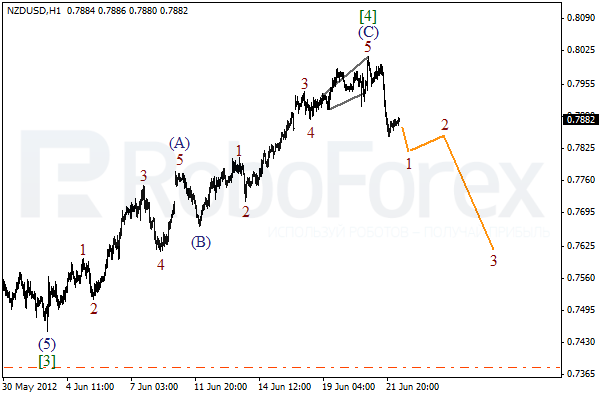
As we can see at the H1 chart, wave (C) has been completed with the fifth wave in the form of divergent diagonal triangle pattern. At the moment the pair is forming a bearish impulse in wave 1. All these factors indicate that the price may continue falling down during the next several days.
EUR/USD
After finishing wave 2 very close to the maximum of wave (4), Euro started moving downwards inside the third one. There is a possibility that the price may reach a new local minimum during the next several days. The target is still at the level of 1.2000.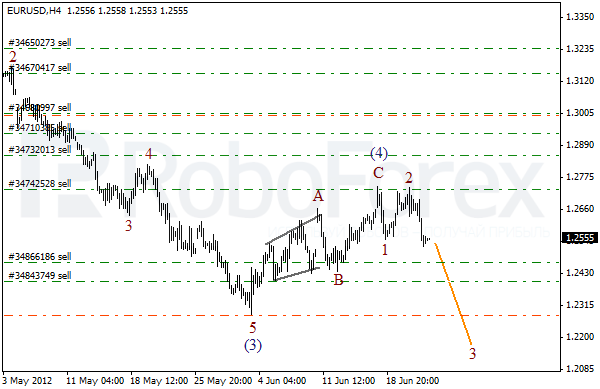
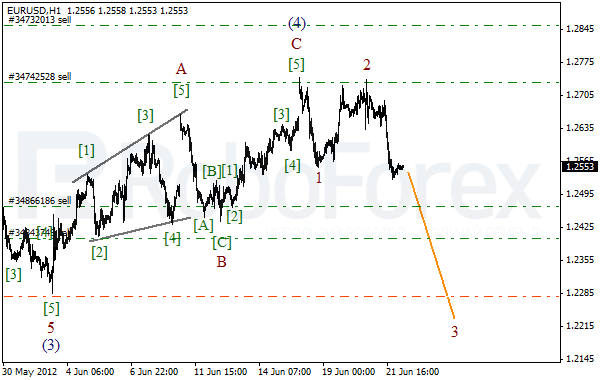
More detailed wave structure is shown on the H1 chart. Yesterday the price finished wave 2. The local correction is taking place inside wave 3. Most likely, the pair will continue falling down during the day.
Attention!
Forecasts presented in this section only reflect the author’s private opinion and should not be considered as guidance for trading. RoboForex bears no responsibility for trading results based on trading recommendations described in these analytical reviews.