Wave Analysis 30.07.2013 (DJIA Index, Crude Oil)
30.07.2013
Analysis for July 30th, 2013
DJIA Index
It looks like the Index completed the fourth wave and started the fifth one. Most likely, the price will break the maximum of wave (3) during this week. The stop on my buy order is already in the black.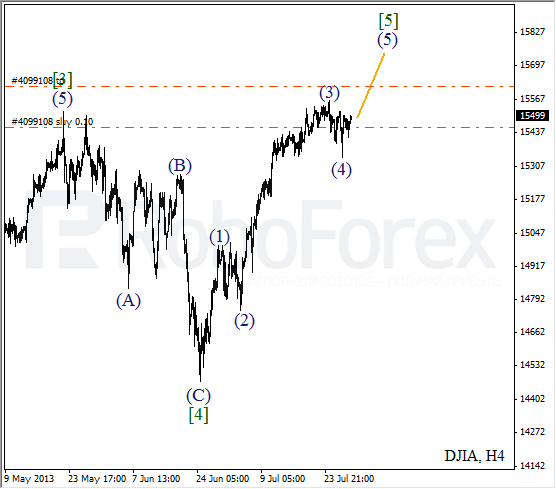
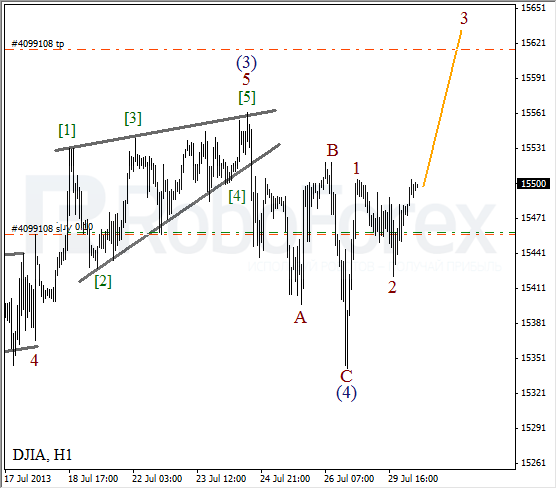
As we can see at the H1 chart, wave (4) took the form of zigzag pattern. Earlier the price formed diagonal triangle pattern inside wave 5 of (3). We may assume that the instrument finished an initial impulse onside wave 1. After completing a local correction, the Index may start moving upwards inside wave 3 of (5).
Crude Oil
Oil is about to finish wave (4). Earlier the price formed an extension inside the third wave and diagonal triangle pattern inside wave 5 of (3). In the near term, the instrument is expected to start growing up inside wave (5).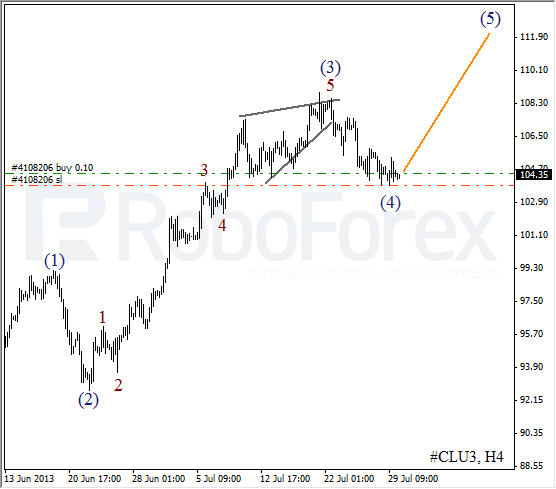
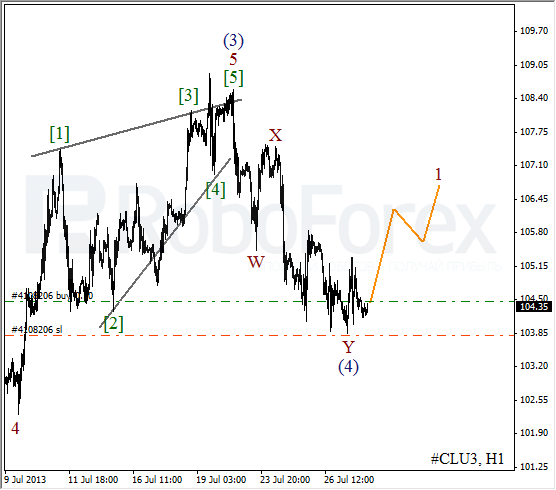
More detailed wave structure is shown on the H1 chart. Wave (4) took the form of double zigzag pattern. On the minor wave level, the instrument formed several initial ascending waves, that’s why I opened a buy order with the stop at the minimum of the fourth wave.
RoboForex Analytical Department
Attention!
Forecasts presented in this section only reflect the author’s private opinion and should not be considered as guidance for trading. RoboForex bears no responsibility for trading results based on trading recommendations described in these analytical reviews.