Wave Analysis 05.09.2013 (DJIA Index, Crude Oil)
05.09.2013
Analysis for September 5th, 2013
DJIA Index
The Index is still being corrected. We may assume that after completing a descending impulse inside wave [A], the price started forming zigzag pattern inside wave [B]. On the minor wave level, the instrument may fall down for a while inside wave (B).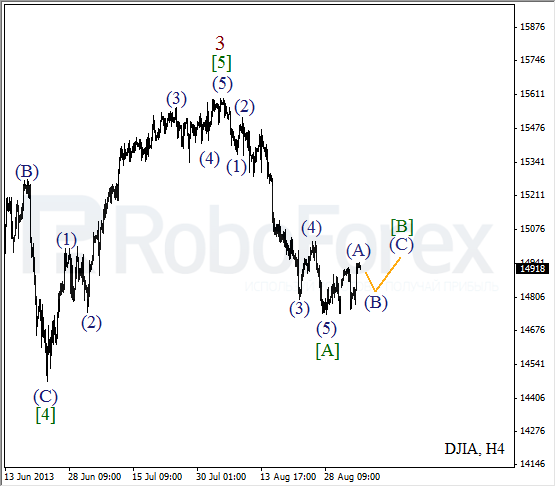
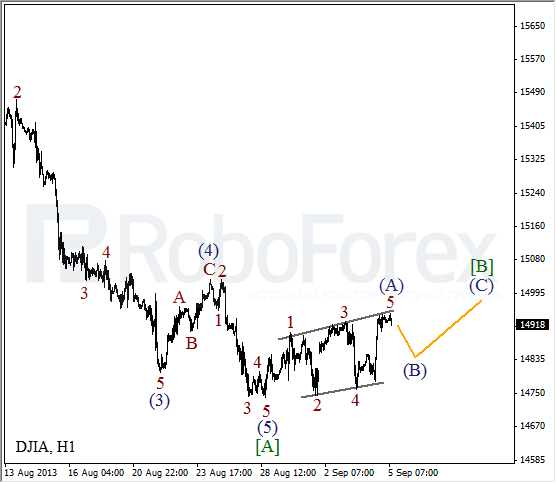
More detailed wave structure is shown on the H1 chart. It looks like the price completed a bullish wedge pattern inside wave (A). Most likely, after a slight correction, the instrument will form another ascending impulse inside wave (C) of [B].
Crude Oil
It looks like after completing skewed triangle pattern inside wave (4), the market formed an initial ascending impulse. A local correction may yet continue for a while, that’s why I’ve placed a pending buy order. In the future, the price is expected to start the third wave.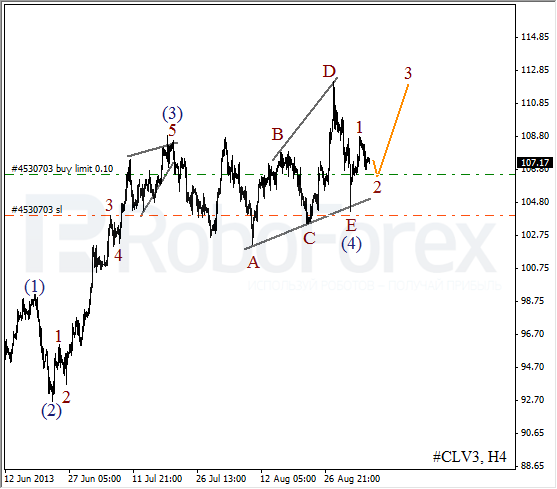
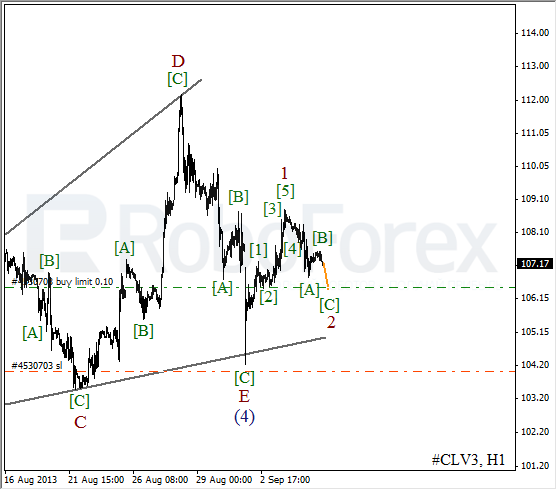
As we can see at the H1 chart, the price is forming zigzag pattern inside wave 2. On the minor wave level, Oil is falling down inside wave [C]. The second wave may be completed during the day.
RoboForex Analytical Department
Attention!
Forecasts presented in this section only reflect the author’s private opinion and should not be considered as guidance for trading. RoboForex bears no responsibility for trading results based on trading recommendations described in these analytical reviews.