Wave Analysis 11.09.2013 (DJIA Index, Crude Oil)
11.09.2013
Analysis for September 11th, 2013
DJIA Index
The Index is still being corrected. After completing an impulse inside wave [A], the price started forming zigzag pattern inside wave [B]. Most likely, the instrument will finish an impulse inside wave (C) during the next several days and the start falling down inside wave (1).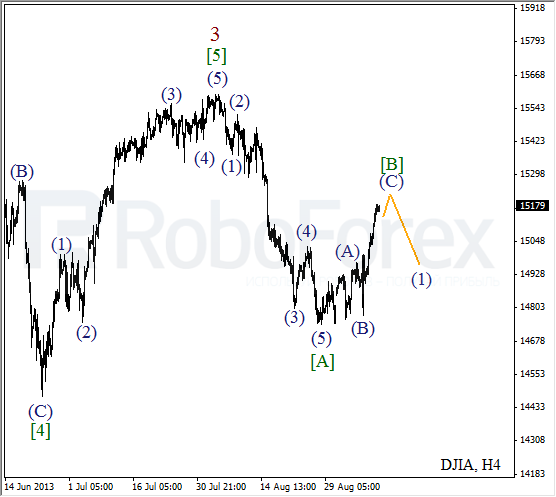
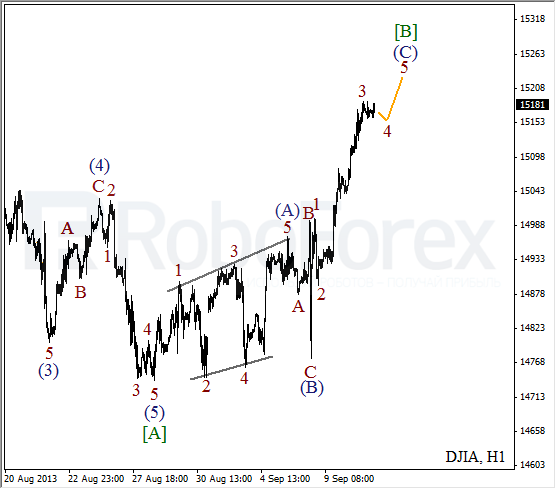
More detailed wave structure is shown on the H1 chart. After completing flat pattern inside wave (B) the price started forming an ascending impulse inside wave (C) with the fourth wave inside it. Later, after finishing a local correction, the price is expected to start a new ascending movement inside wave 5 of (C).
Crude Oil
We may assume that the market is forming diagonal triangle pattern. Earlier Oil finished skewed triangle pattern inside wave (4). We can’t exclude a possibility that during the next several days the price may start moving upwards inside wave 3 of (5).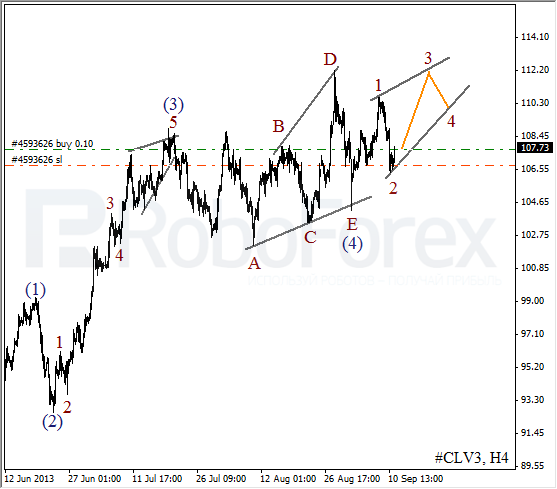
As we can see at the H1 chart, yesterday the price formed zigzag pattern inside wave 2. I’ve got only one buy order so far, but I’m planning to open several more later. We can’t exclude a possibility that instrument may break the maximum until the end of this week.

RoboForex Analytical Department
Attention!
Forecasts presented in this section only reflect the author’s private opinion and should not be considered as guidance for trading. RoboForex bears no responsibility for trading results based on trading recommendations described in these analytical reviews.