RoboForex
Wave Analysis 20.09.2013 (DJIA Index, Crude Oil)
20.09.2013Analysis for September 20th, 2013
The Index is finishing wave (3) inside diagonal triangle pattern. Most likely, in the nearest future the price will start a new correction, which may be a deep one.
DJIA Index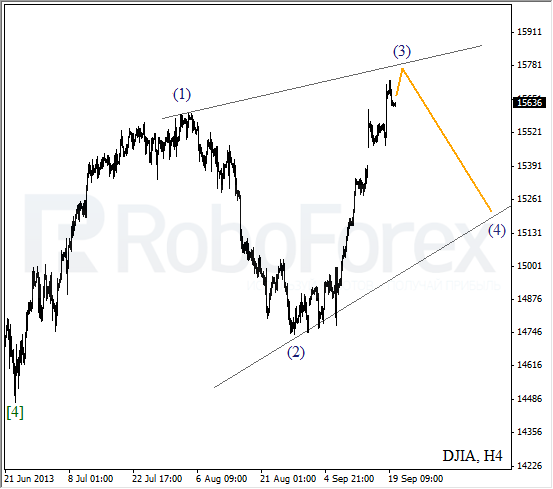
More detailed wave structure is shown on the H1 chart. It looks like wave 5 is taking the form of diagonal triangle pattern. The market may yet continue moving upwards for a while, but later it is expected to start a correction.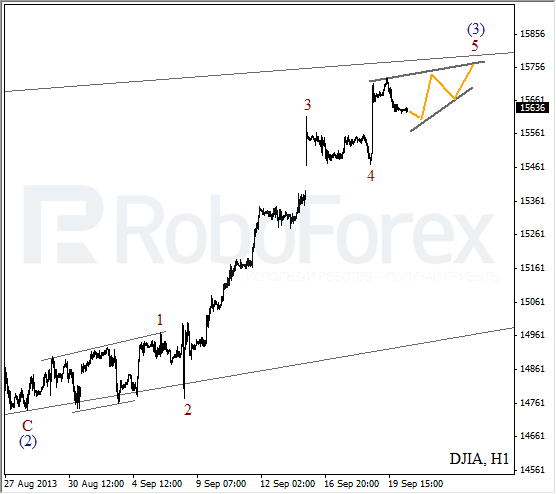
Crude Oil
At the H4 chart, after completing triangle pattern inside wave (4), Oil formed an initial ascending impulse. Right now, the market is being corrected. Most likely, during the next several the price will start growing up inside wave 3.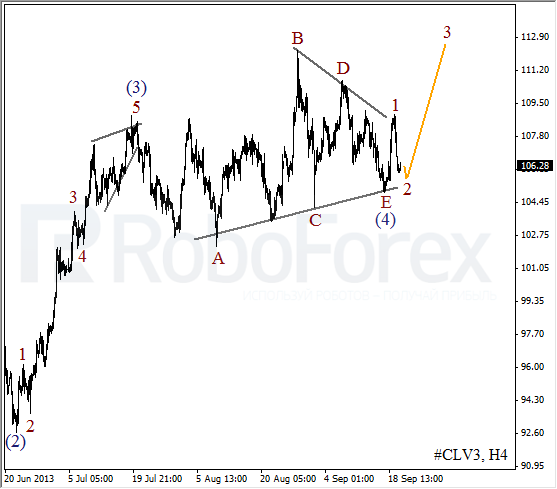
As we can see at the H1 chart, wave 2 is taking the form of zigzag pattern. The critical level here is the minimum of wave 1. I’m planning to open a buy order after the price completes an initial ascending impulse.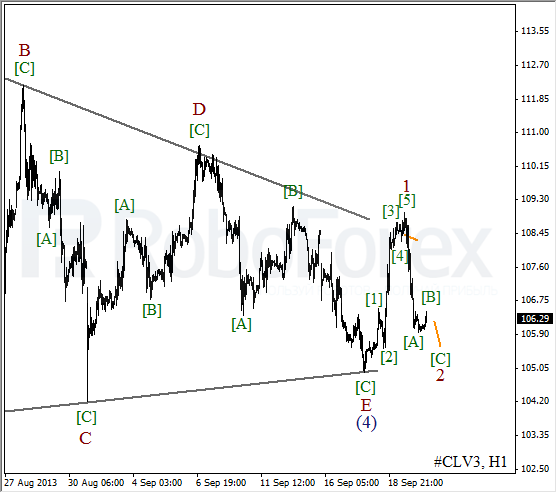
RoboForex Analytical DepartmentAttention!Forecasts presented in this section only reflect the author’s private opinion and should not be considered as guidance for trading. RoboForex bears no responsibility for trading results based on trading recommendations described in these analytical reviews.