Wave Analysis 28.09.2012 (DJIA Index, Crude Oil)
28.09.2012
Analysis for September 28th, 2012
DJIA Index
We may assume that the price continues forming diagonal triangle pattern inside wave (5) of [1]. In the near term, the Index is expected to start moving upwards again. Later the bulls may reach the levels of 13700-13800, and then the instrument may start a corrective movement.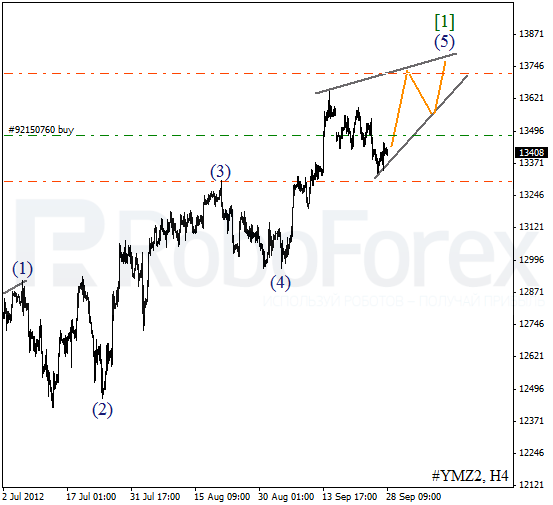
At the H1 chart wave 2 has been completed in the form of zigzag pattern. It looks like the price has started to form the third wave. The Index may break a local maximum by the middle of the next week.

Crude Oil
We can’t exclude a possibility that the correction has been already finished and wave 2 has taken the form of zigzag pattern. On the minor wave level Oil is forming an initial wave [1]. In the near term, we can expect the price to continue growing up.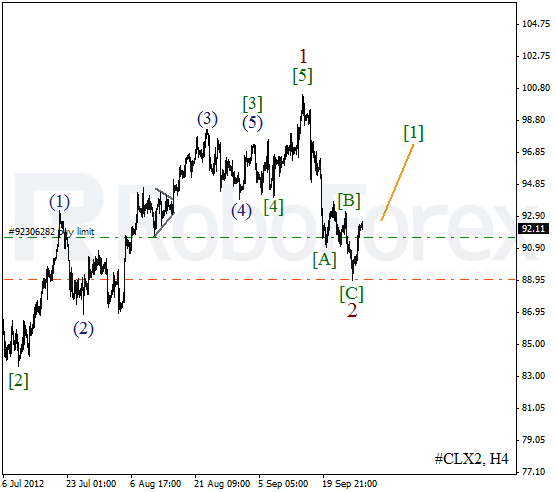
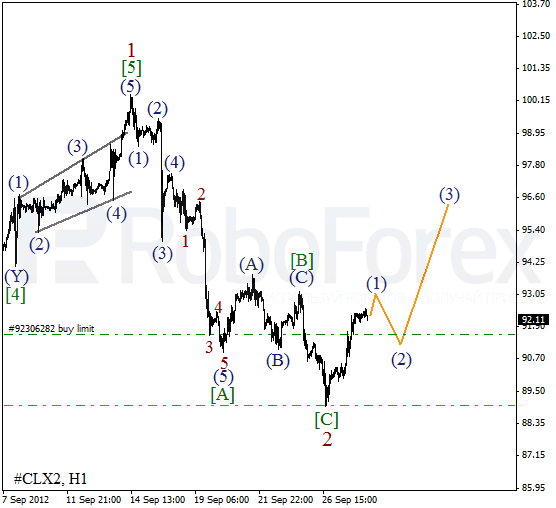
As we can see at the H1 chart, wave [C] of 2 turned out to be quite short. At the moment Oil is finishing wave (1). After the instrument finishes a corrective movement, the price is expected to start growing up inside wave (3) of [1].
Attention!
Forecasts presented in this section only reflect the author’s private opinion and should not be considered as guidance for trading. RoboForex bears no responsibility for trading results based on trading recommendations described in these analytical reviews.