Wave Analysis 10.02.2015 (EUR/USD, GBP/USD, USD/JPY, USD/CAD)
10.02.2015
Analysis for February 10th, 2015
EUR USD, “Euro vs US Dollar”
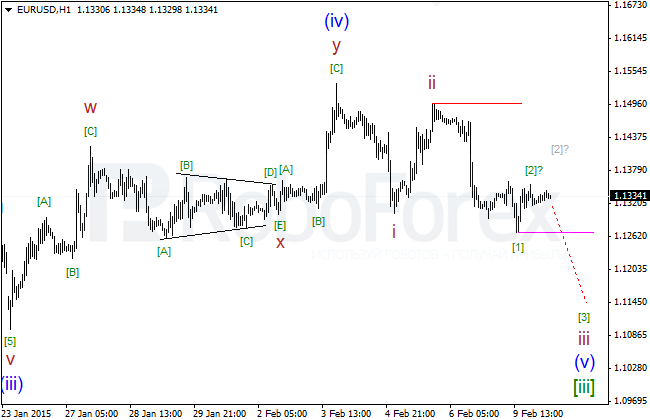
The price is moving below its critical level inside wave (v) of [iii]. In the nearest future, the pair is expected to start forming a descending impulse towards 1.0900.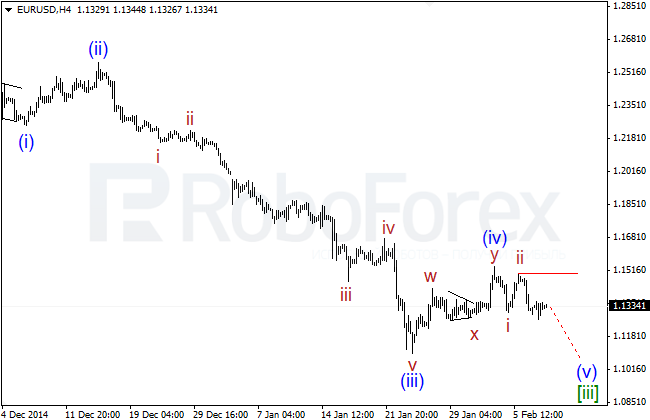
Most likely, the pair has just completed impulse [1] of iii of (v) of [iii] and already started a new correction inside wave [2]? of iii of (v) of [iii]. Probably, the price has already finished an ascending zigzag. In this case, the market may break the confirming level at 1.1268 and then continue moving downwards.
GBP USD, “Great Britain Pound vs US Dollar”
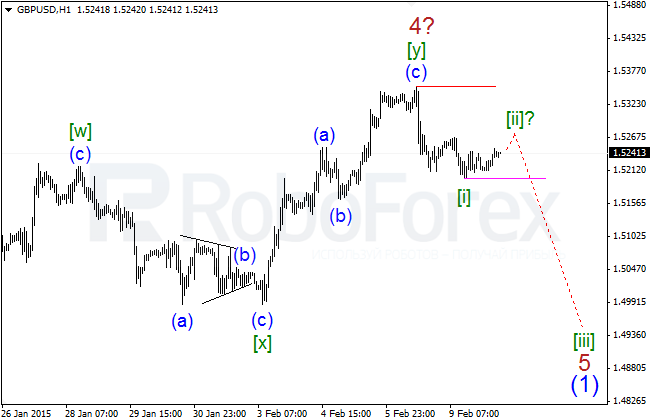
The price is moving below its critical level at 1.5352 and still forming a descending impulse 5 of (1). Most likely, the market has formed only the first descending impulse inside the fifth wave (the last one). The pair is expected to continue falling.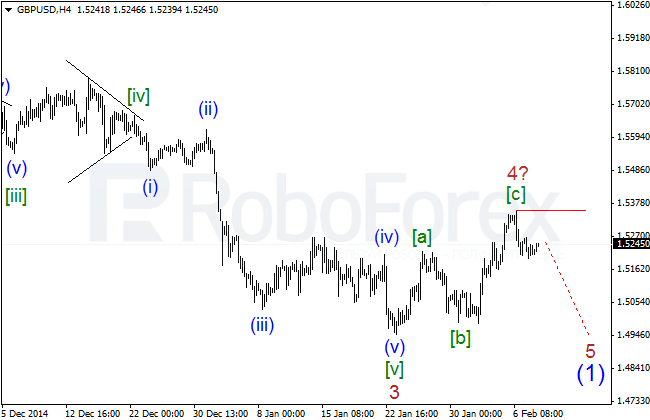
Most likely, the pair has just completed impulse [i] of 5 of (1) and right now is moving inside wave [ii] of 5 of (1). In the nearest future, the market is expected to break the confirming level at 1.5198 and start a more serious and stronger descending movement.
USD JPY, “US Dollar vs Japanese Yen”
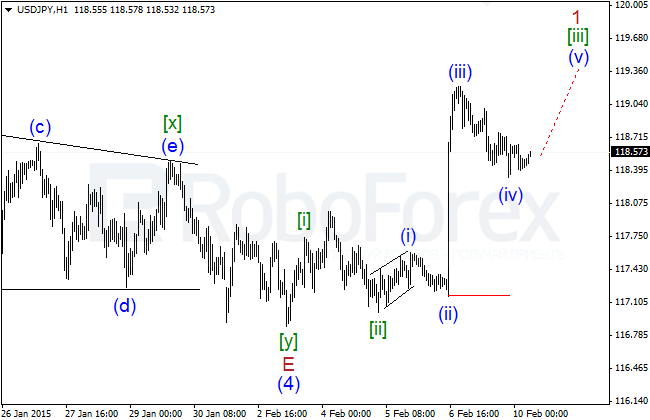
The pair continues forming impulse 1 of (5) of [5]. The descending movement of the price from the maximum at 119.21 looks like a correction, that’s why in the nearest future the market is expected to continue moving upwards.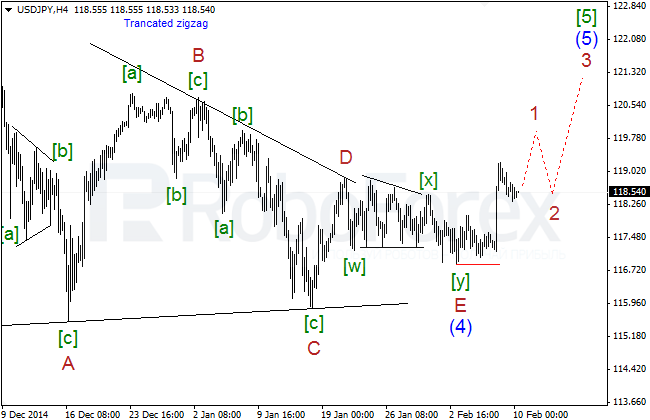
Most likely, the pair is finishing wave (iv) of [iii] of 1 of (5) of [5] in the form of double zigzag. In the nearest future, the market is expected to continue growing and complete wave 1 of (5) of [5] inside a larger ascending movement.
USD CAD, “US Dollar vs Canadian Dollar”
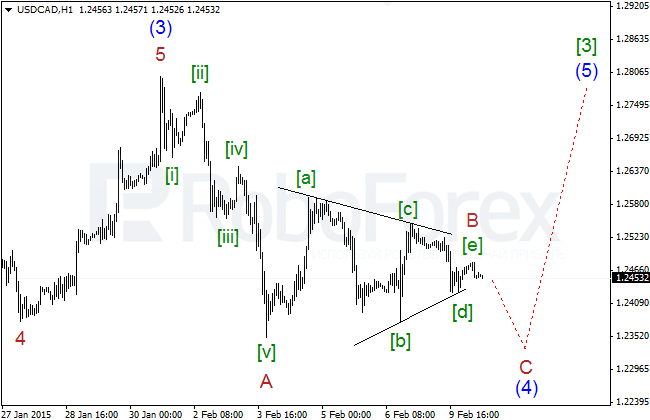
The sideways movement of the price over the last several days makes us change the structure of wave (4) of [3]. Most likely, the pair has only finished wave B inside it, which may have taken the form of horizontal triangle. The market is expected to reach a new local low.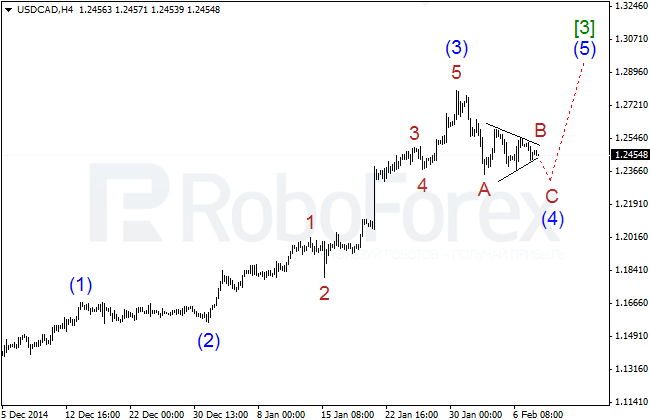
Most likely, the price hasn’t completed wave (4) of [3] yet, which may be taking the form of zigzag. So, wave B of (4) of [3] may be taking the form of horizontal triangle. Most likely, in the nearest future, the market may reach a new local low at 1.2351, complete the whole wave (4) of [3], and only after that start growing inside wave (5) of [3].
RoboForex Analytical Department
Attention!
Forecasts presented in this section only reflect the author’s private opinion and should not be considered as guidance for trading. RoboForex bears no responsibility for trading results based on trading recommendations described in these analytical reviews.