Wave Analysis 04.10.2013 (DJIA Index, Crude Oil)
04.10.2013
Analysis for October 4th, 2013
DJIA Index
We may assume that the Index is forming diagonal triangle pattern inside wave [5]. If the price rebounds from the pattern’s lower border, the bulls will return to the market. Right now, I’m staying out of the market.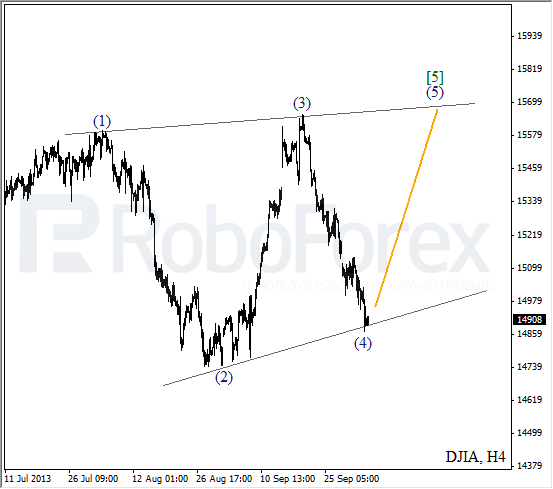
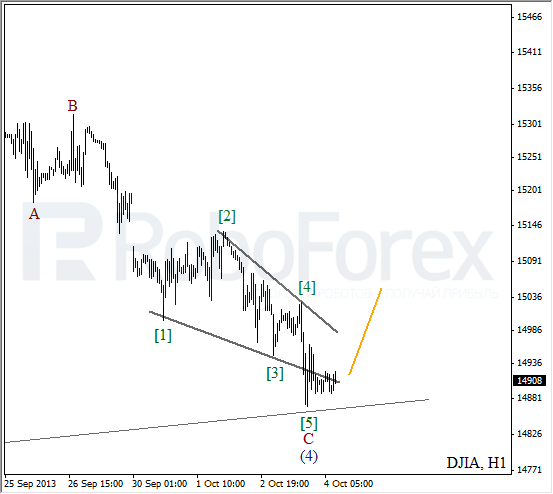
More detailed wave structure is shown on the H1 chart. The price formed diagonal triangle pattern inside wave C. If later the market forms an initial ascending impulse, I’ll open several buy orders.
Crude Oil
There is a possibility that Oil finished double three pattern inside wave (4). On the minor wave level, the price formed an initial bullish impulse. After completing a local correction, the instrument is expected to continue moving upwards.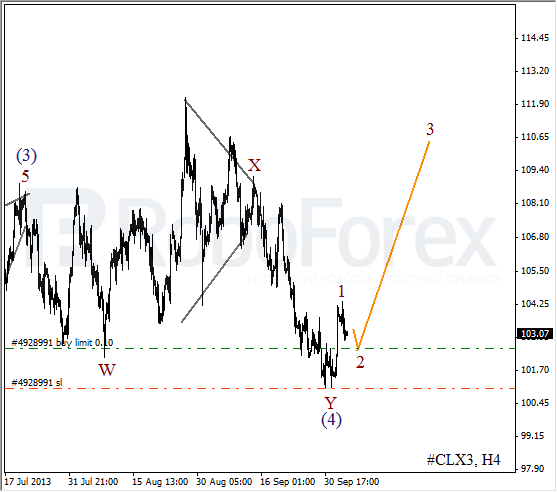
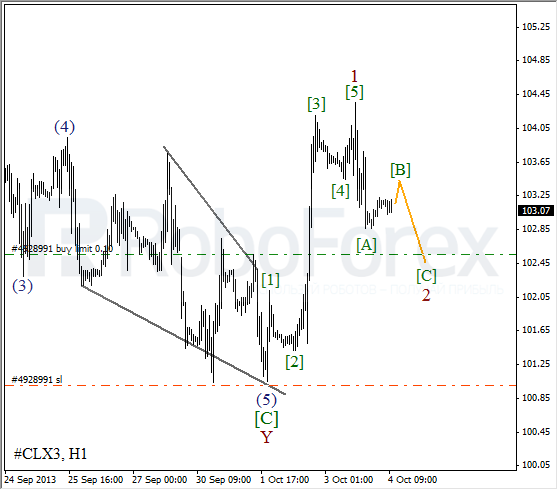
As we can see at the H1 chart, wave 2 may take the form of zigzag triangle. On the minor wave level, the market is finishing wave [B]. Most likely, the instrument will continue falling down inside wave [C] of 2 during the day.
RoboForex Analytical Department
Attention!
Forecasts presented in this section only reflect the author’s private opinion and should not be considered as guidance for trading. RoboForex bears no responsibility for trading results based on trading recommendations described in these analytical reviews.