Wave Analysis 07.10.2013 (DJIA Index, Crude Oil)
07.10.2013
Analysis for October 7th, 2013
DJIA Index
The Index continues forming the fourth wave inside diagonal triangle pattern. The price got very close to the critical level, which is the minimum of wave (2). We can’t exclude a possibility that the instrument may start forming wave (5) of [5] in the nearest future.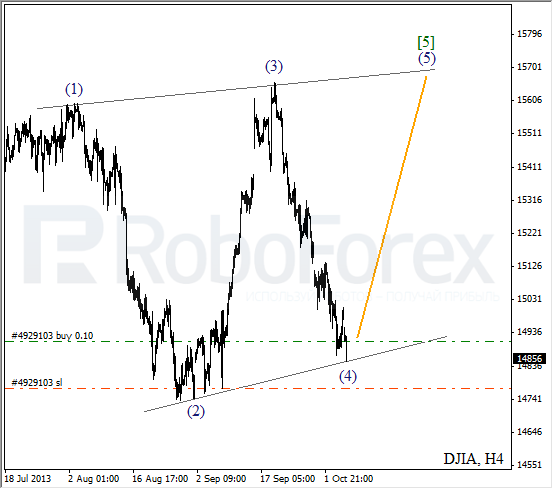
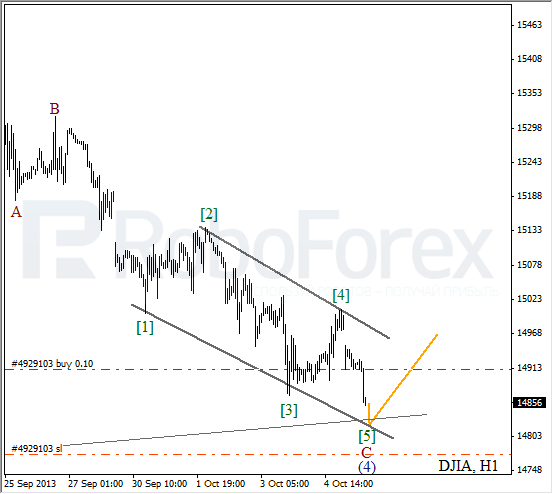
More detailed wave structure is shown on the H1 chart. We may assume that the price is finishing diagonal triangle pattern inside wave C. I’ll increase my long positions as soon as the instrument forms an initial ascending impulse.
Crude Oil
We can’t exclude a possibility that Oil finished wave (4) in the form of double three pattern. After completing a local correction, the instrument is expected to continue moving upwards and may form an extension inside wave 3.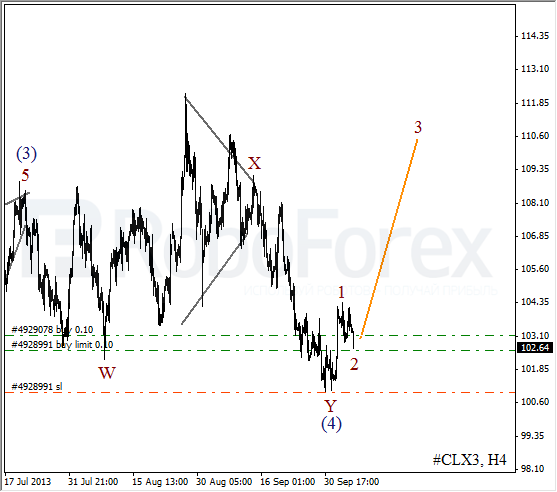
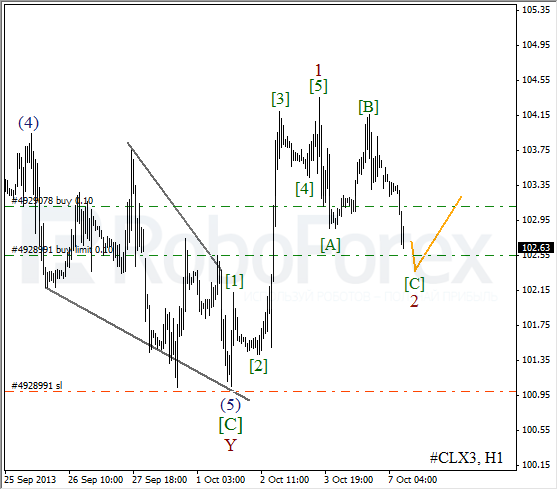
As we can see at the H1 chart, after completing an ascending impulse inside wave 1, the market started a correction. It looks like right now Oil is forming zigzag pattern inside wave 2. In the nearest future, the instrument is expected to continue falling down inside wave [C].
RoboForex Analytical Department
Attention!
Forecasts presented in this section only reflect the author’s private opinion and should not be considered as guidance for trading. RoboForex bears no responsibility for trading results based on trading recommendations described in these analytical reviews.