Wave Analysis 09.10.2013 (DJIA Index, Crude Oil)
09.10.2013
Analysis for October 9th, 2013
DJIA Index
The Index continues moving downwards, forcing us to reconsider the chart structure. We can’t exclude a possibility that the price completed a large bullish impulse inside wave (3). It looks like the instrument is going to continue the correction during the next several weeks.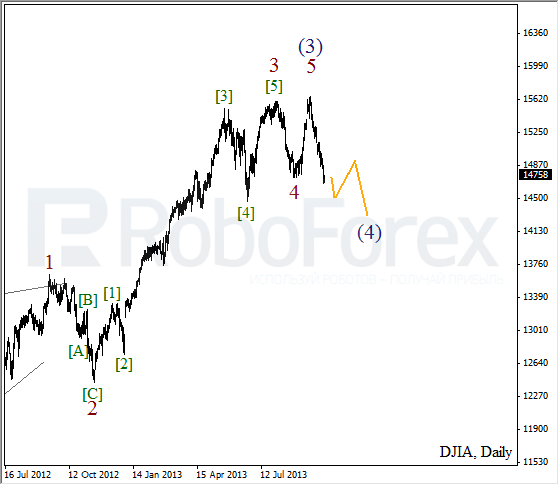
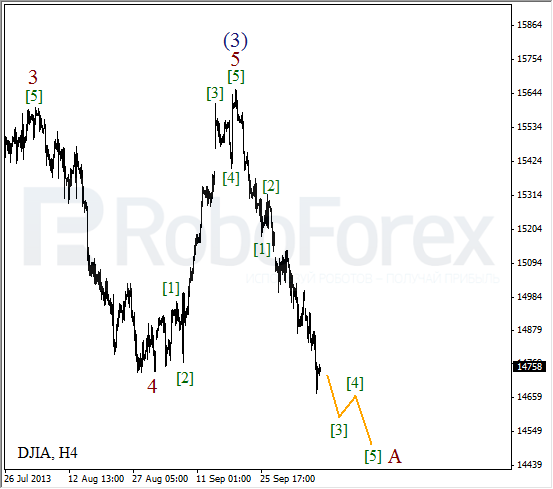
More detailed wave structure is shown on the H1 chart. We may assume that the price is forming a bearish impulse inside wave A with the third wave inside it. The instrument may continue moving downwards during the next several days.
Crude Oil
Oil finished wave (4) in the form of double three pattern. On the minor wave level, the price completed an initial ascending impulse. Most likely, during the next several days the instrument will continue growing up inside the third wave.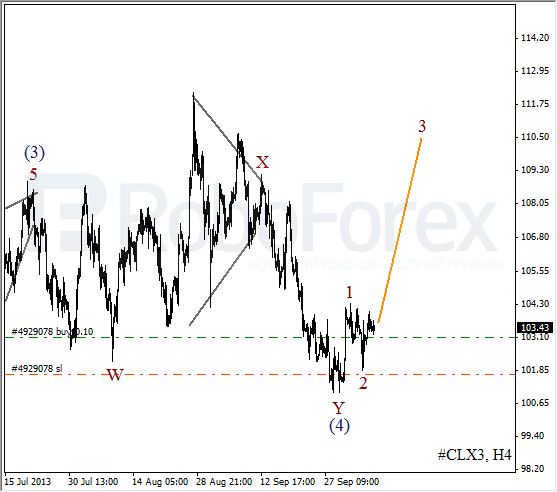
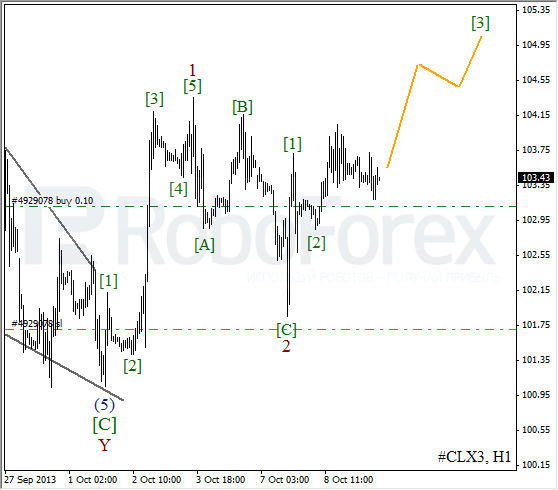
As we can see at the H1 chart, the market may extend wave [3] inside wave 3. After a local correction, the instrument is expected to start a new ascending movement.
RoboForex Analytical Department
Attention!
Forecasts presented in this section only reflect the author’s private opinion and should not be considered as guidance for trading. RoboForex bears no responsibility for trading results based on trading recommendations described in these analytical reviews.