Wave Analysis 17.10.2012 (DJIA Index, Crude Oil)
17.10.2012
Analysis for October 17th, 2012
DJIA Index
The chart structure confirms that the Index completed zigzag pattern inside wave [2]. It looks like the price continues forming an ascending impulse inside wave (1). The market may break a local maximum before the end of the week.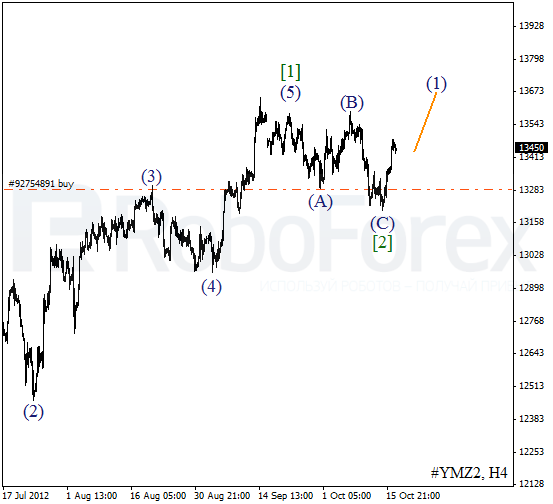
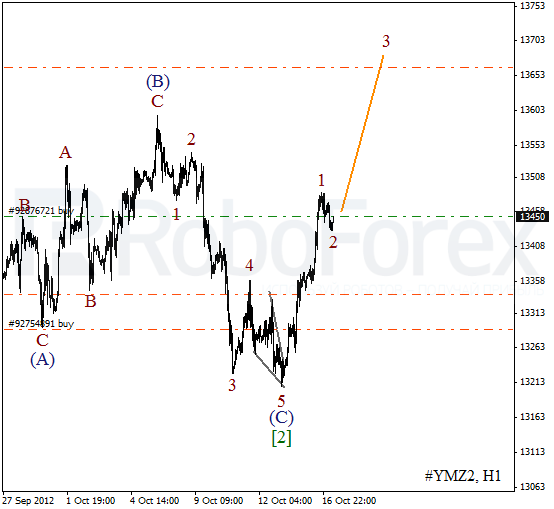
As we can see at the H1 chart, after completing diagonal triangle pattern inside wave 5 of (C), the price formed an initial impulse inside wave 1. During the day we can expect the instrument to start moving upwards and form wave 3 of (1).
Crude Oil
We may assume that Oil completed zigzag pattern inside wave 2. At the moment the price is forming divergent wedge pattern inside the first one on the minor wave level. The instrument may continue moving upwards in the nearest future and break a local maximum before the end of the week.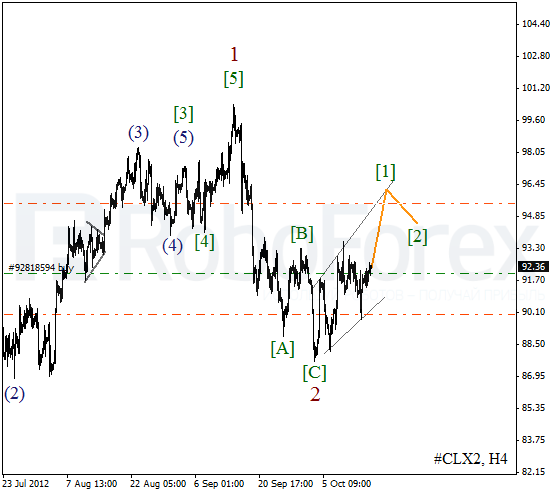
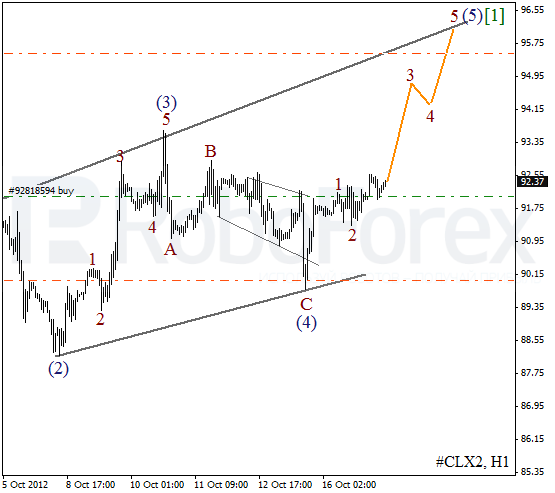
At the H1 chart we can see that the price is starting to form an ascending impulse inside wave 3. Earlier Oil completed diagonal triangle pattern inside wave C of (4). The bulls may reach the level of $95 per barrel of Light Sweet within the next several days.
RoboForex Analytical Department
Attention!
Forecasts presented in this section only reflect the author’s private opinion and should not be considered as guidance for trading. RoboForex bears no responsibility for trading results based on trading recommendations described in these analytical reviews.