Wave Analysis 29.10.2013 (DJIA Index, Crude Oil)
29.10.2013
Analysis for October 29th, 2013
DJIA Index
The Index continues forming an ascending zigzag pattern inside wave B. On the minor wave level, the price is forming an impulse inside wave [C]. In the near term, the instrument is expected to continue moving upwards, but later it may reverse downwards.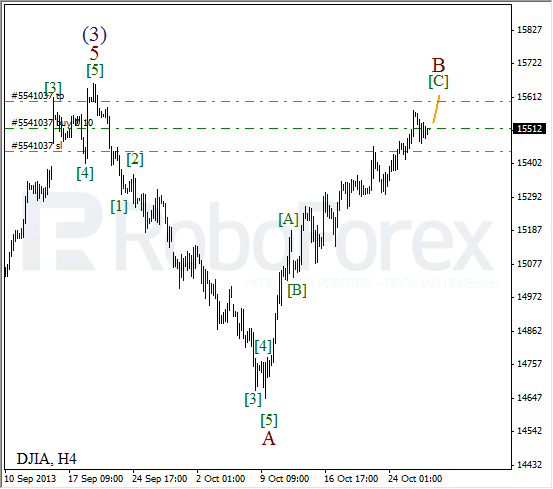
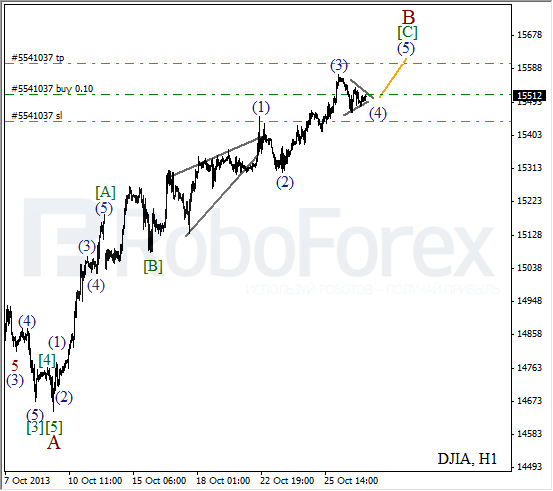
More detailed wave structure is shown on the H1 chart. It looks like the price is forming horizontal triangle pattern inside wave (4). After the correction, I opened a short-term buy order with the target at the end of the fifth wave.
Crude Oil
The bears are still forming an impulse inside wave [A] with the fifth wave inside it. During the correction, I opened a short-term sell order. We can’t exclude a possibility that during the next several hours the instrument will reach a new local minimum.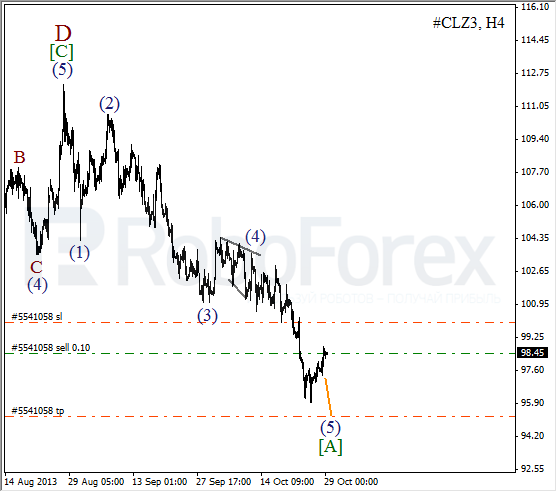
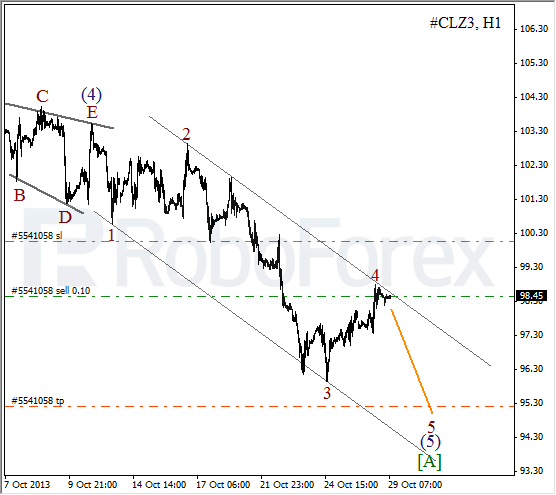
As we can see at the H1 chart, the instrument is moving inside the descending channel and forming a bearish impulse inside wave (5). If the price rebounds from the channel’s upper border, the instrument will start a new descending movement inside wave 5 of (5).
RoboForex Analytical Department
Attention!
Forecasts presented in this section only reflect the author’s private opinion and should not be considered as guidance for trading. RoboForex bears no responsibility for trading results based on trading recommendations described in these analytical reviews.