Wave Analysis 11.11.2013 (DJIA Index, Crude Oil)
11.11.2013
Analysis for November 11th, 2013
DJIA Index
Bulls just can’t stop. It looks like they continue forming wave [5], but in the form of diagonal triangle pattern. In the nearest future, instrument may break maximum while forming wave (3).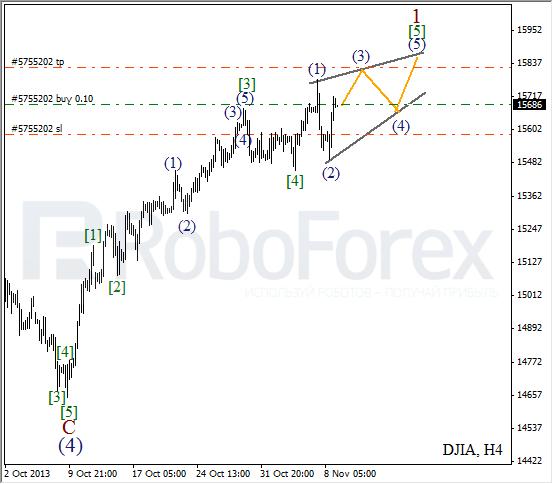
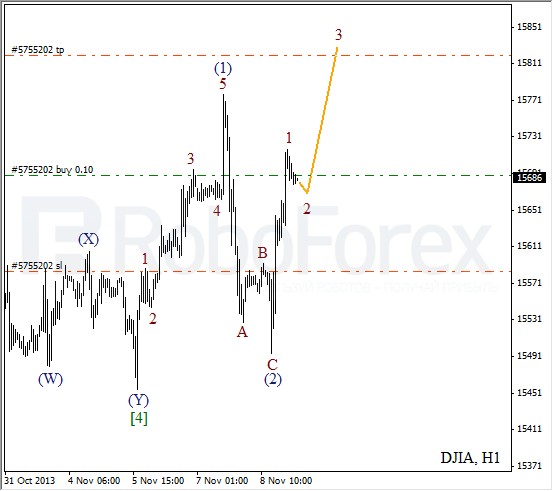
More detailed wave structure is shown on the H1 chart. Price completed wave (2) in the form of zigzag pattern and then formed an ascending impulse on minor wave level. After local correction, instrument is expected to start growing up inside the third wave.
Crude Oil
Current chart structure implies that Oil completed descending impulse inside wave [A]. It looks like price is starting correction. In the near term, I expect local growth inside wave (A).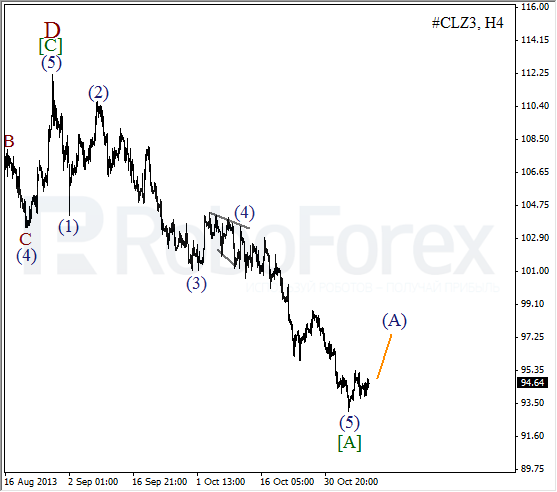
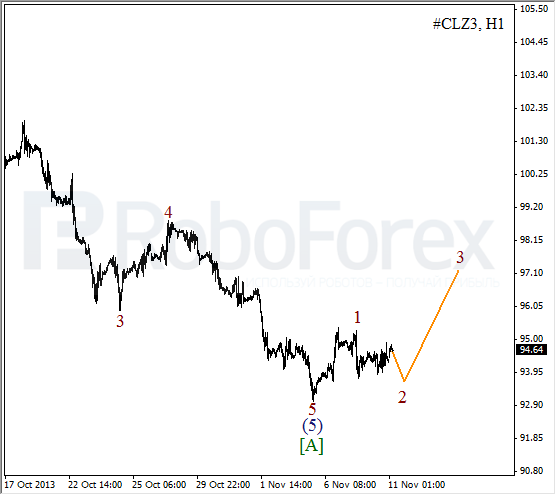
As we can see at H1 chart, impulse in wave 1 was completed with truncation inside short fifth wave. During the day, instrument may continue correction inside the second wave, but later it is expected to start growing up inside the third one.
RoboForex Analytical Department
Attention!
Forecasts presented in this section only reflect the author’s private opinion and should not be considered as guidance for trading. RoboForex bears no responsibility for trading results based on trading recommendations described in these analytical reviews.