Wave Analysis 14.11.2013 (DJIA Index, Crude Oil)
14.11.2013
Analysis for November 14th, 2013
DJIA Index
Index continues moving upwards; yesterday it broke maximum. It looks like price is forming ascending diagonal triangle pattern in wave [5] with the third wave inside it. In the near term, instrument is expected to continue growing up.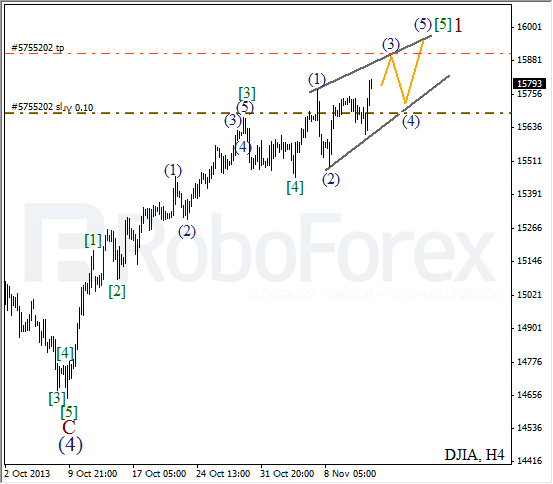
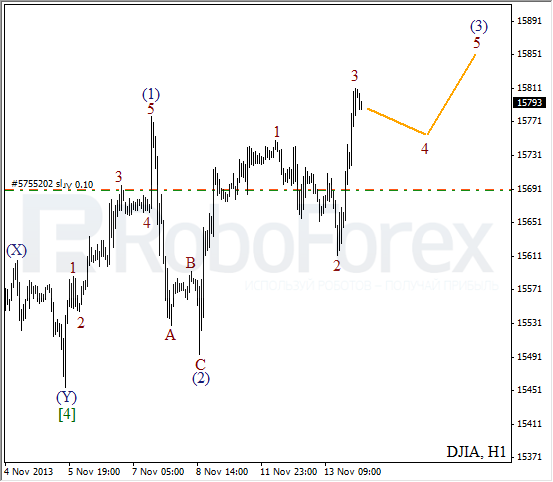
More detailed wave structure is shown on H1 chart. Probably, price is forming bullish impulse inside wave (3). On minor wave level, instrument may start correction, after which it is expected to continue growing up inside wave 5 of (3).
Crude Oil
Bears continue pushing price downwards. It looks like after finishing wave (4), Oil started forming the fifth one. Most likely, in the future market will reach new minimum while forming descending impulse.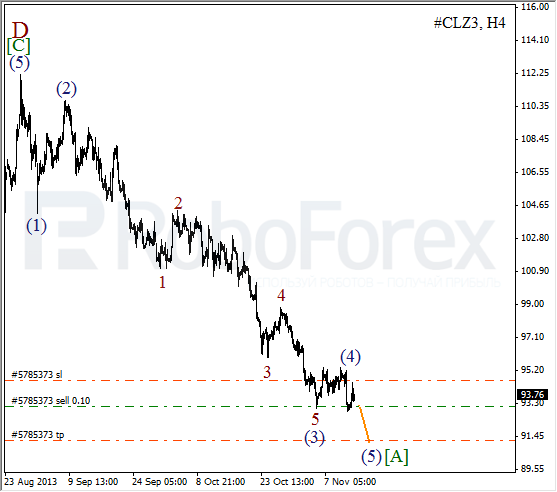
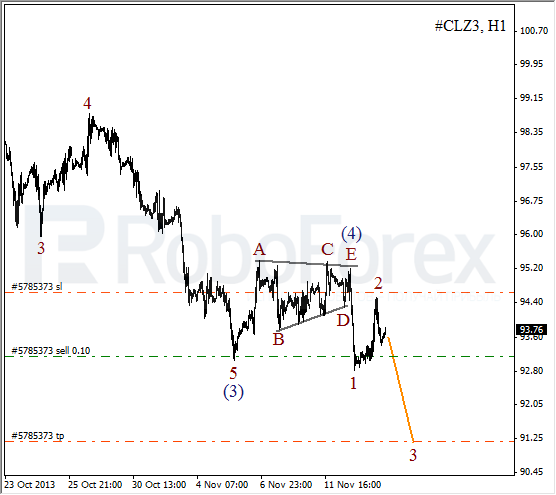
As we can see at H1 chart, wave (4) took the form of horizontal triangle pattern inside wave (4). After completing initial impulse inside wave 1, instrument formed correction. In the future, Oil is expected to start falling down inside the third wave.
RoboForex Analytical Department
Attention!
Forecasts presented in this section only reflect the author’s private opinion and should not be considered as guidance for trading. RoboForex bears no responsibility for trading results based on trading recommendations described in these analytical reviews.