Wave Analysis 23.11.2012 (DJIA Index, Crude Oil)
23.11.2012
Analysis for November 23rd, 2012
DJIA Index
It looks like the Index is finishing zigzag pattern inside wave [2]. Earlier the price formed a descending wedge pattern inside the first wave. Most likely, the instrument will finish a corrective movement in the nearest future, then make a reverse and start falling down inside [3].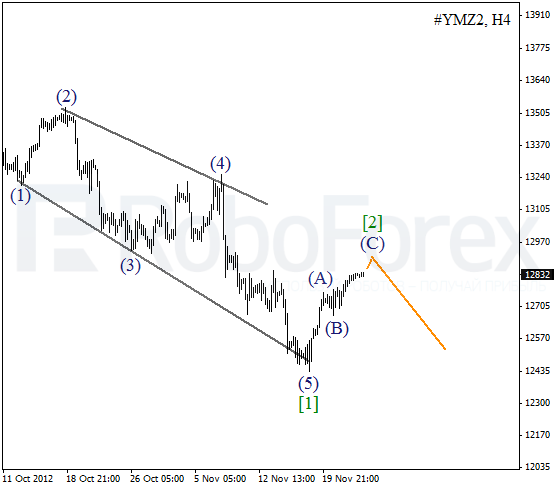
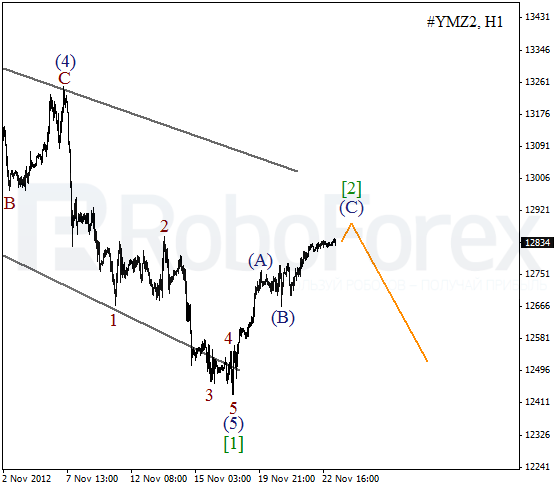
As we can see at the H1 chart, the Index is completing a bullish impulse inside wave (C). The market may grow up a bit during Friday, but later the instrument is expected to start a new descending movement.
Crude Oil
We may assume that the price finished wave (2). At the moment Oil is forming first waves inside a new descending wave (3). After a little pause, the instrument is expected to start a new descending movement.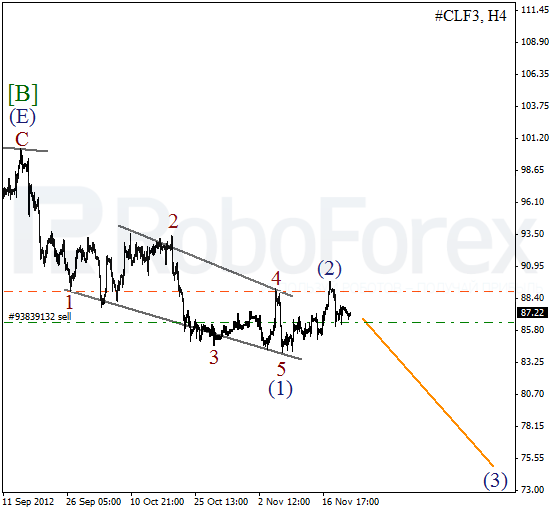
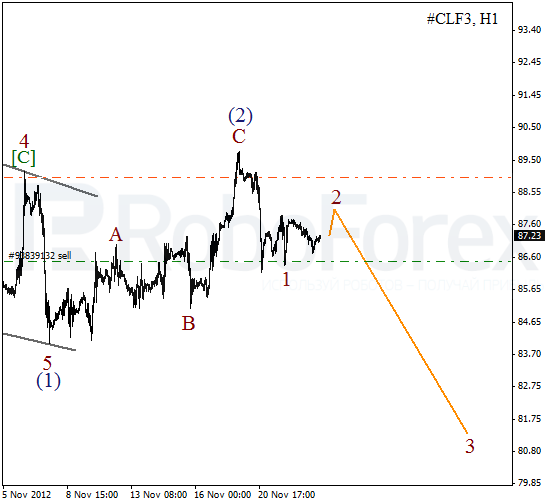
At the H1 chart we can see that wave 1 was completed a bit reduced. Earlier wave 2 was finished in the form of zigzag pattern. During Friday Oil is expected to start an ascending movement, which later may turn into wave 3.
RoboForex Analytical Department
Attention!
Forecasts presented in this section only reflect the author’s private opinion and should not be considered as guidance for trading. RoboForex bears no responsibility for trading results based on trading recommendations described in these analytical reviews.