Wave Analysis 28.11.2012 (DJIA Index, Crude Oil)
28.11.2012
Analysis for November 28th, 2012
DJIA Index
It looks like after completing a descending wedge pattern inside wave [1], the Index is forming zigzag pattern inside the second one. On the minor wave level the price is being corrected inside wave (B). Most likely, the instrument will continue growing up while forming wave (C) of [2].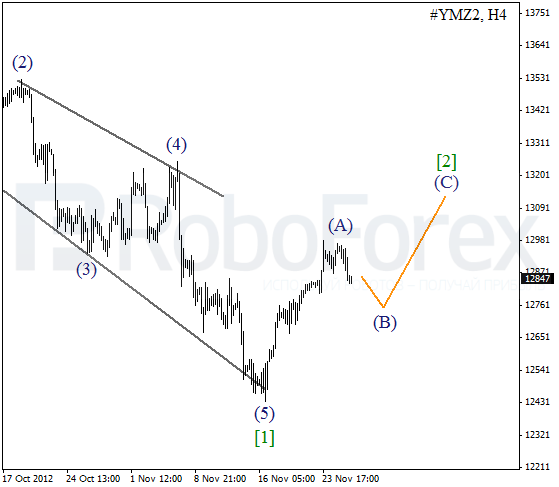
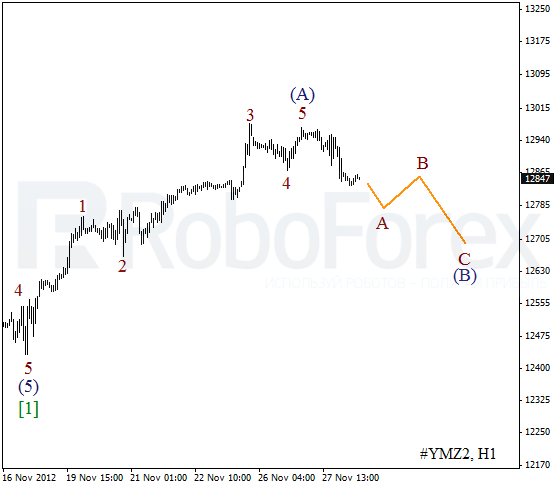
As we can see at the H1 chart, wave 5 was completed a bit short. At the moment the price is forming a descending impulse inside wave A. Most likely, the instrument will continue its corrective movement during the next several days.
Crude Oil
It looks like the market is starting wave (3). Earlier Oil finished a descending wedge pattern inside the first wave and completed a local correction. One of these days the instrument may break a local minimum and the bears will continue pushing the price towards the level of $75 per barrel of Light Sweet.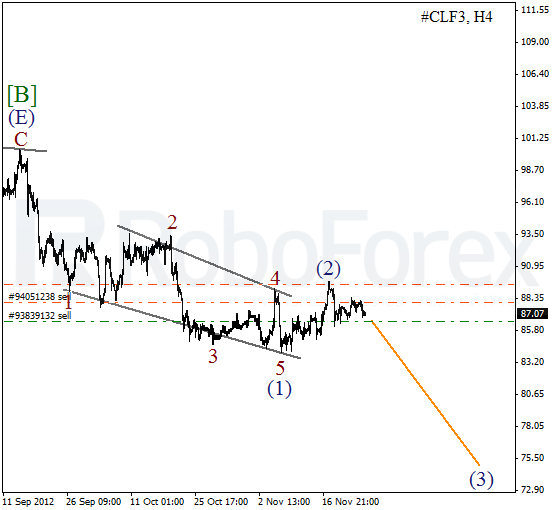
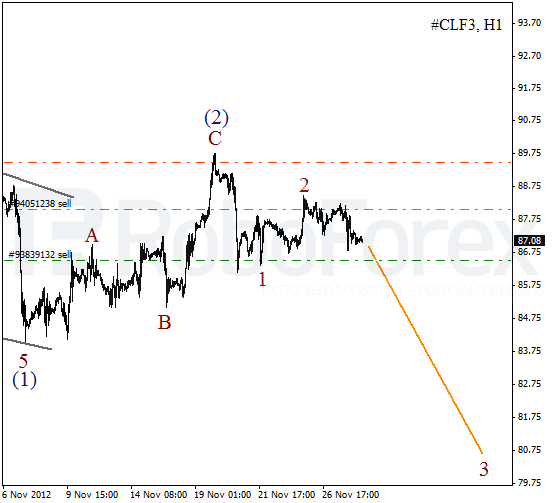
More detailed wave structure is shown on the H1 chart. We may assume that earlier wave 2 was completed in the form of zigzag pattern. At the moment the instrument is forming initial descending waves inside the third one. The forecast is still bearish.
RoboForex Analytical Department
Attention!
Forecasts presented in this section only reflect the author’s private opinion and should not be considered as guidance for trading. RoboForex bears no responsibility for trading results based on trading recommendations described in these analytical reviews.