Wave Analysis 30.11.2012 (DJIA Index, Crude Oil)
30.11.2012
Analysis for November 30th, 2012
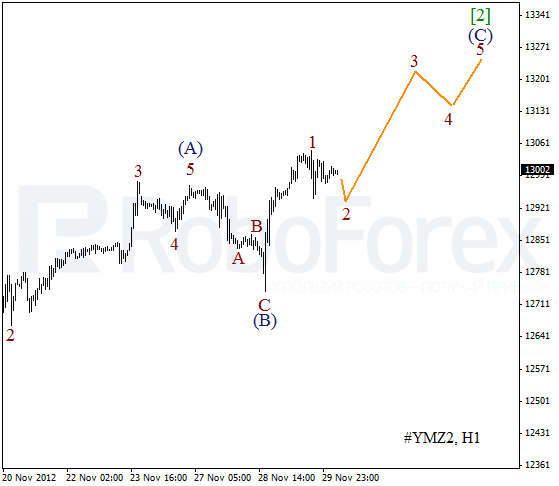
DJIA Index
The Index continues a corrective movement; it looks like wave [2] is taking the form of zigzag pattern. Earlier the price formed a descending wedge pattern inside wave [1]. In the near term, the instrument may continue growing up for a while, but later it is expected to start forming the third descending wave.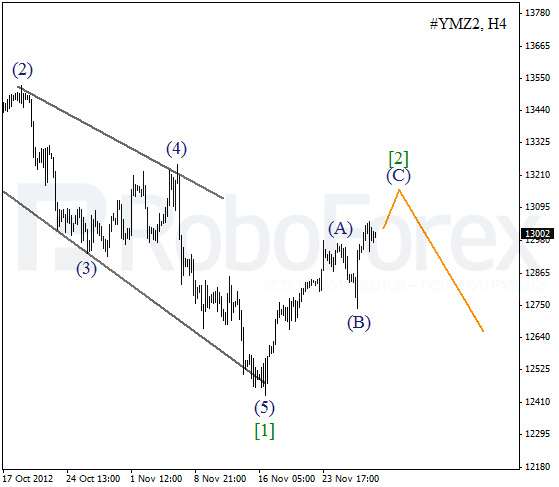
Yesterday, after completed zigzag pattern inside wave (B), the Index formed a bullish impulse. The market may be corrected for a while inside wave 2, but later it is expected to start moving downwards inside the third one.
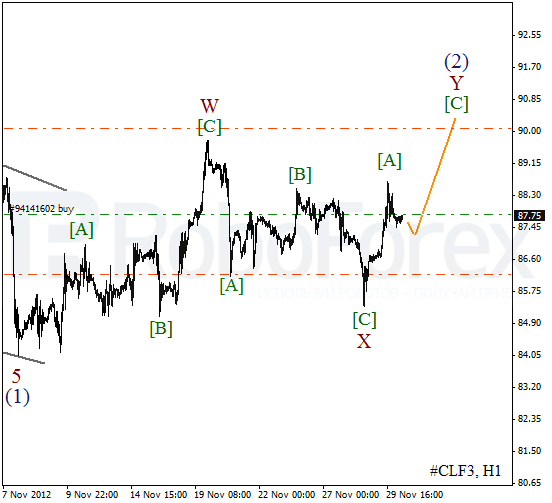
Crude Oil
Oil also continues a corrective movement. We may assume that wave (2) is taking the form of double zigzag pattern. On the minor wave level the price is forming wave Y. Most likely, in the nearest future the instrument will break a local maximum.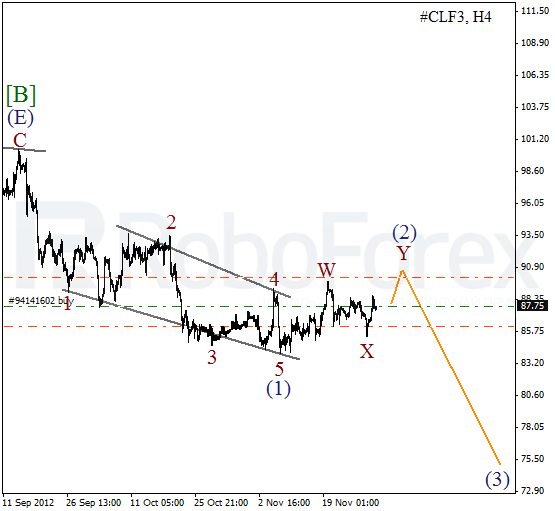
As we can see at the H1 chart, after completing zigzag pattern inside wave B, the price finished an ascending impulse inside wave [A]. There is a possibility that on Friday the bulls may push the price up to a local maximum and even reach it. Later Oil is expected to start moving downwards again and form wave (3).
RoboForex Analytical Department
Attention!
Forecasts presented in this section only reflect the author’s private opinion and should not be considered as guidance for trading. RoboForex bears no responsibility for trading results based on trading recommendations described in these analytical reviews.