Wave Analysis 02.12.2013 (DJIA Index, Crude Oil)
02.12.2013
Analysis for December 2nd, 2013
DJIA Index
Bullish trend continues. It looks like right now price is finishing the fourth wave inside wave [5]. In the near term, instrument may complete local correction and start new ascending movement inside wave (5) of [5].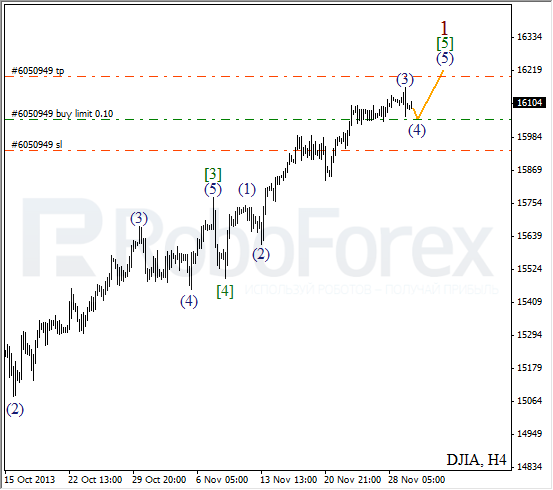
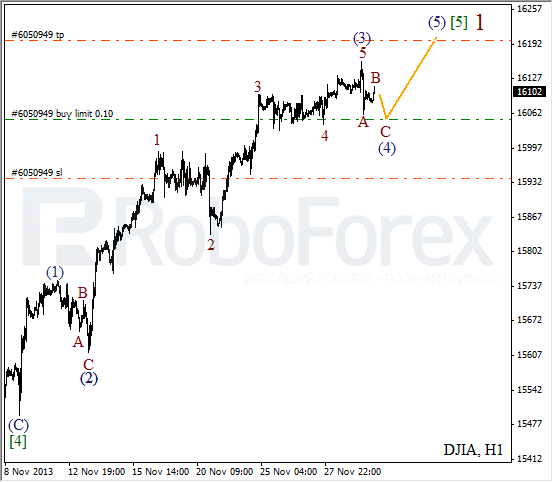
More detailed new wave structure is shown on H1 chart. Probably, wave (4) is taking the form of zigzag pattern. Price may form another bearish wave during the day, that’s why I’ve placed limit buy order.
Crude Oil
Considering that by now Oil has formed only three waves down pattern, future descending movement is possible only in the form of diagonal triangle pattern. During current correction, I opened sell order with stop placed at local maximum.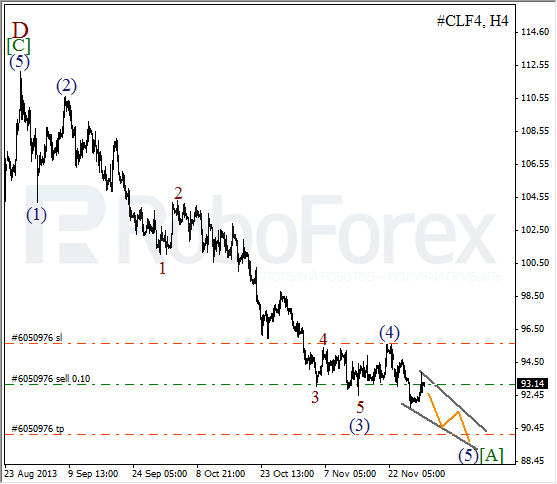
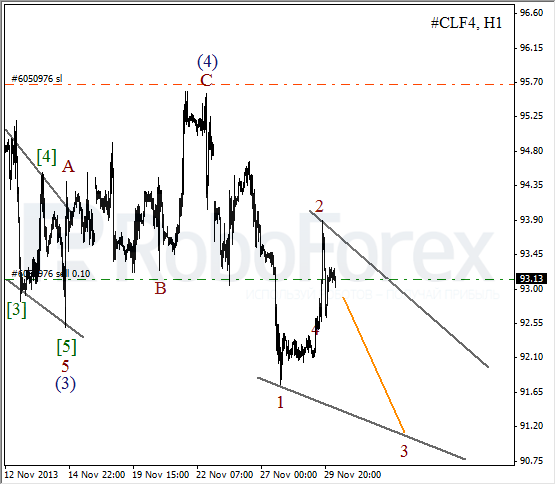
As we can see at the H1 chart, wave (4) was completed in the form of zigzag pattern. Later, instrument formed zigzag pattern inside wave 1 of diagonal triangle pattern, and right now is finishing the second wave. In the nearest future, price is expected to move downwards inside the third wave.
RoboForex Analytical Department
Attention!
Forecasts presented in this section only reflect the author’s private opinion and should not be considered as guidance for trading. RoboForex bears no responsibility for trading results based on trading recommendations described in these analytical reviews.