Murrey Math Lines 13.07.2017 (AUD/JPY, NZD/CAD)
AUD JPY, “Australian Dollar vs Japanese Yen”
At the H4 chart, the AUD/JPY pair is expected to grow towards the resistance at the 8/8 level at 87.50. Later, the price may rebound from this level and fall towards the 5/8 one at 85.15.

At the H1 chart, we can see the strong resistance at the 8/8 level at 87.50. The pair may rebound from this level and continue moving downwards.

At the M15 chart, we should wait until the price breaks the downside line of the VoltyChannel indicator after reaching 87.50. If it happens, the pair is very likely to fall and reach 85.15.

NZD CAD, “New Zealand Dollar vs Canadian Dollar”
At the H4 chart, the NZD/CAD pair broke the 0/8 level at 0.9277 to the upside, which means that the price may reverse and start growing towards the first target at the 3/8 one at 0.9460.
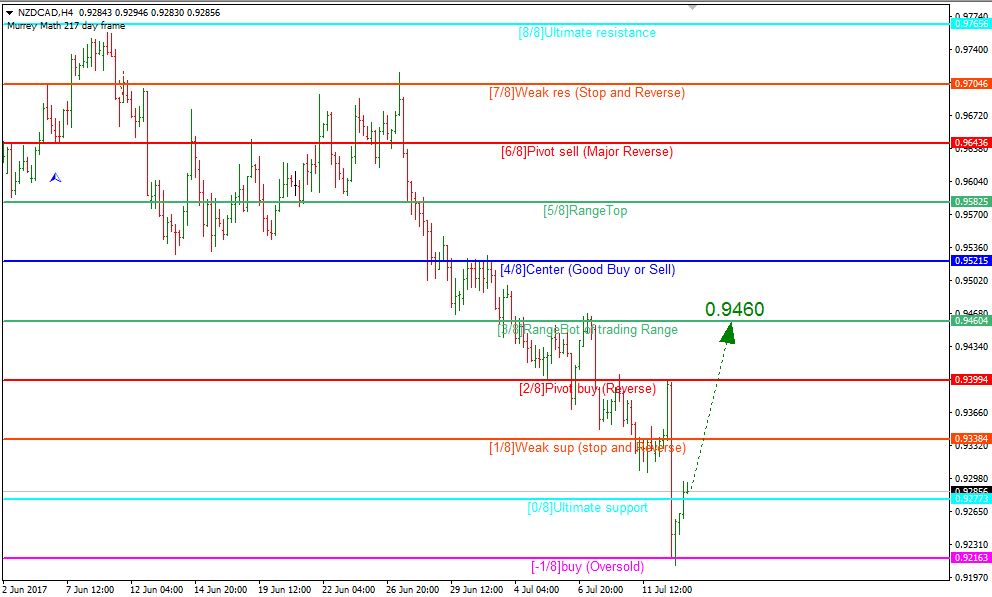
The levels at the H1 and H4 charts are completely the same. Here, the pair also broke the 0/8 level and may continue moving upwards.

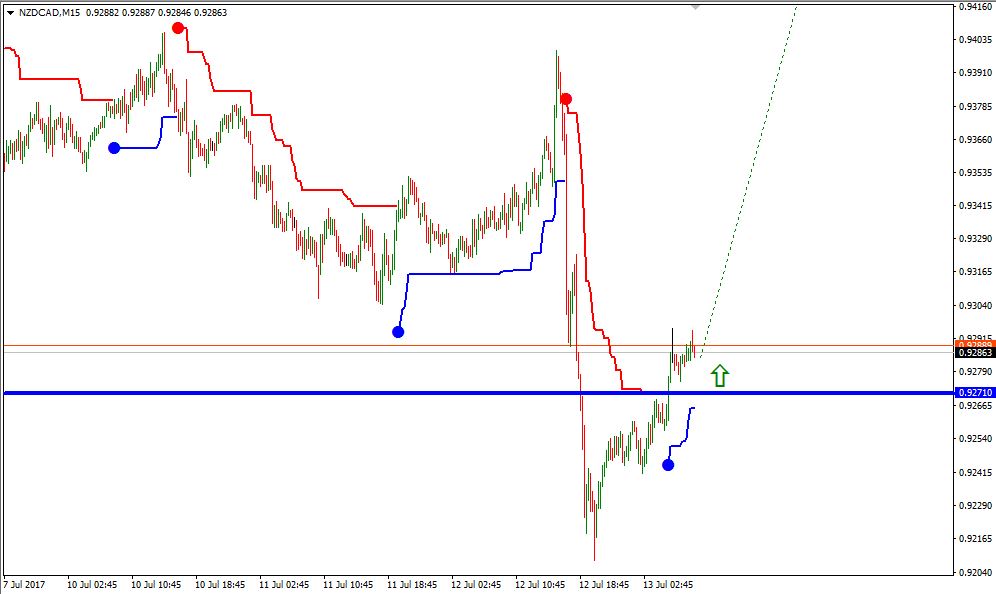
At the M15 chart, the pair broke the upside line of the VoltyChannel indicator and, as a result, may continue its ascending movement towards 0.9460.
RoboForex Analytical Department
Forecasts presented in this section only reflect the author’s private opinion and should not be considered as guidance for trading. RoboForex bears no responsibility for trading results based on trading recommendations described in these analytical reviews.