Murray Math Lines 17.07.2017 (AUD/USD, NZD/CAD)
AUD/USD
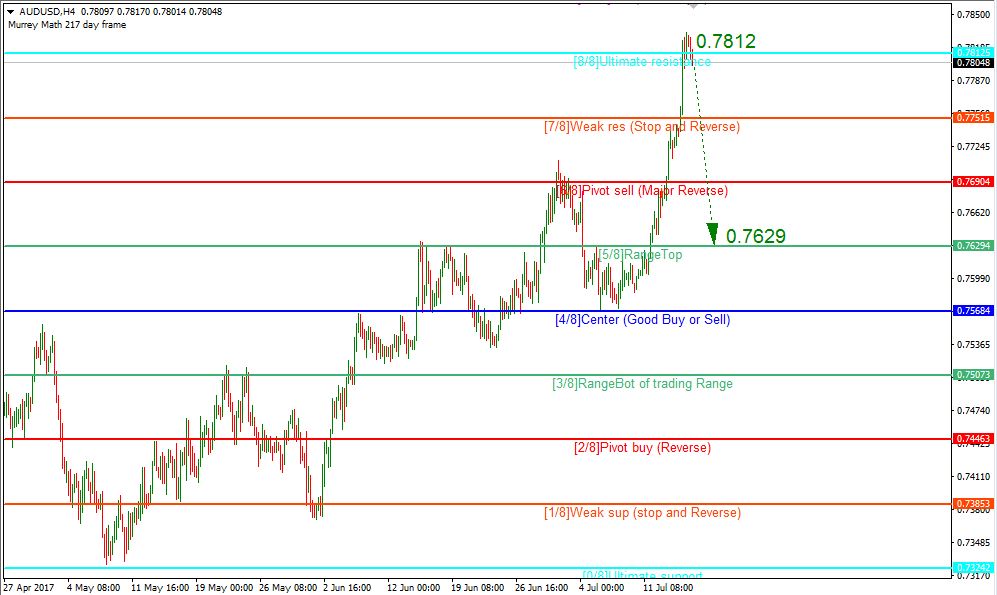
The H4 chart of AUD/USD shows a strong resistance level 8/8 (0.7812) near the current quote. This level is expected to be rebounded from soon and the price can move lower towards 5/8 level (0.7629).
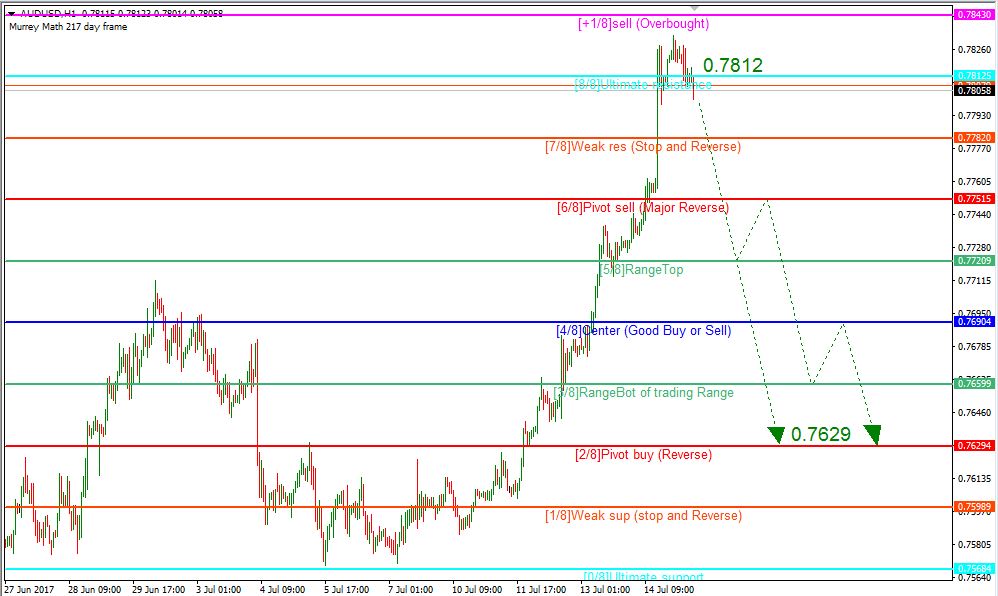
On the H1-chart the price confirms the resistance holding near 8/8 level. This level has been rebounded from, and the pair can move even lower.
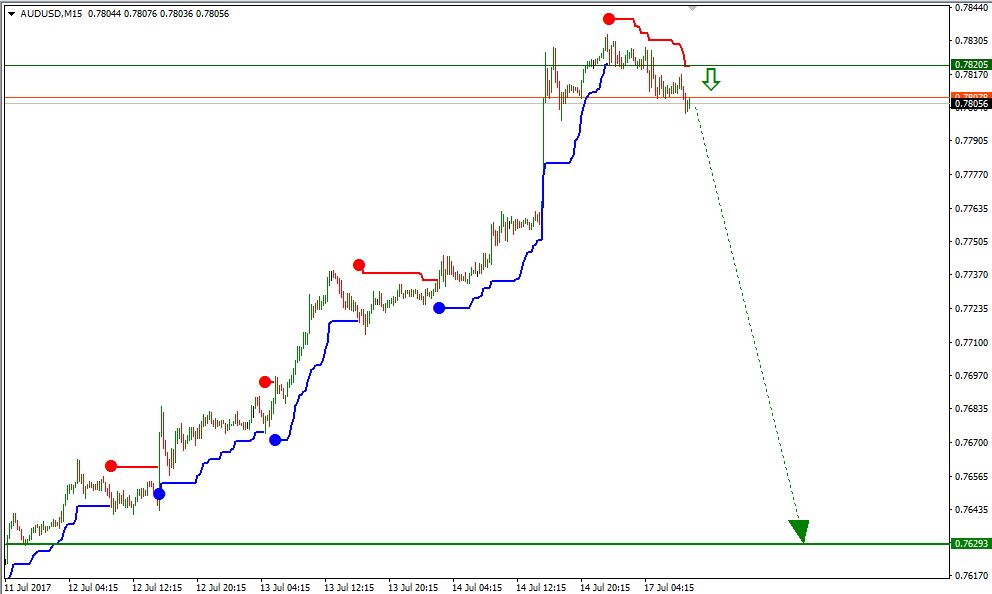
On the M15-level the lower line of VoltyChannel indicator has been broken, and this suggests a possible downside move towards 0.7629.
NZD/CAD
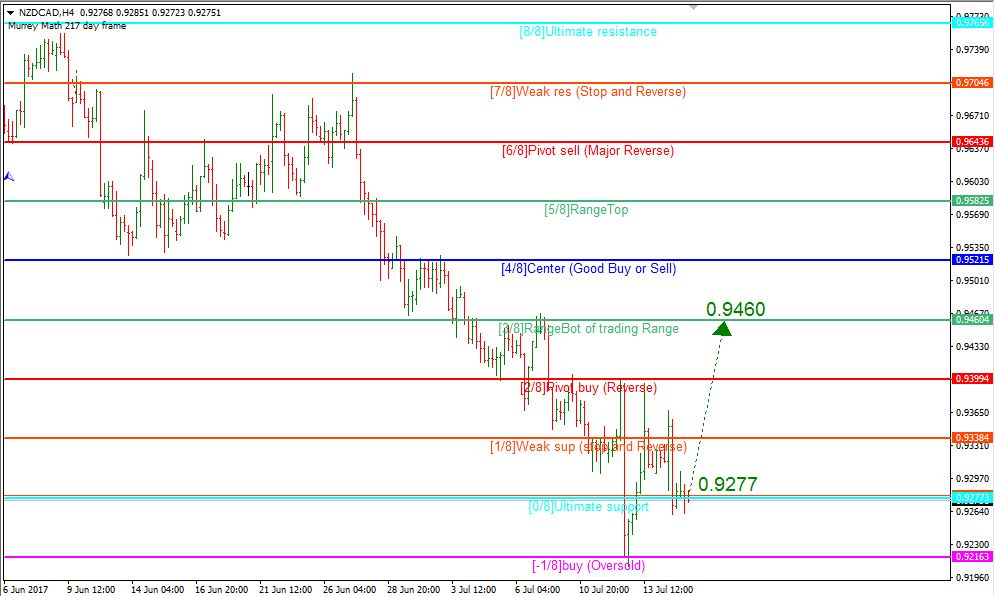
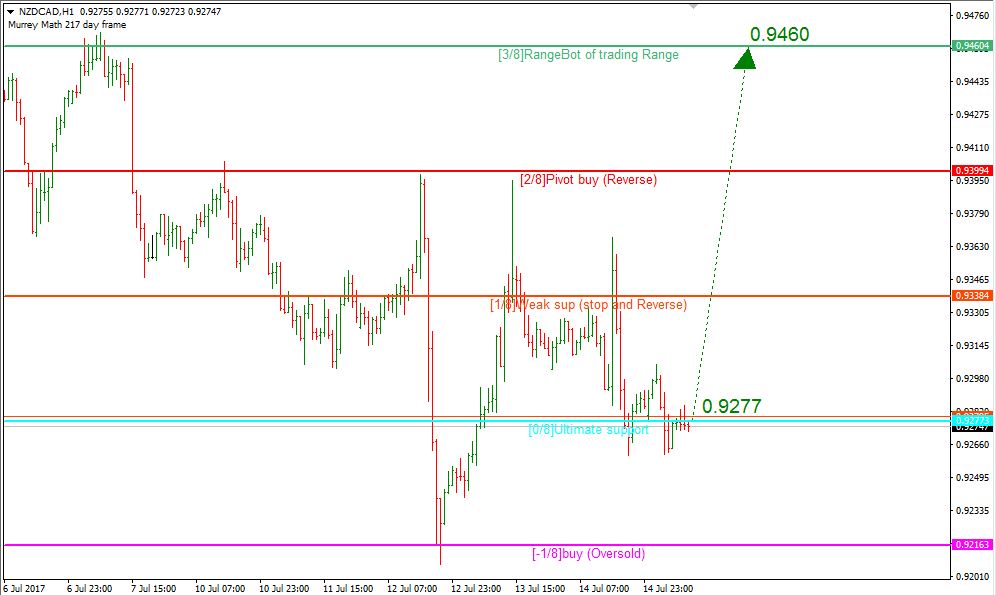
The H4-chart of NZD/CAD shows the price holding at the support level 8/8 (0.9277). It is expected that the price will rebound from 8/8 support level and rise towards 3/8 (0.9460).
On the H1-chart the price is also holding at 8/8 support level which is expected to give space for the price to move higher towards 3/8 level (0.9460).
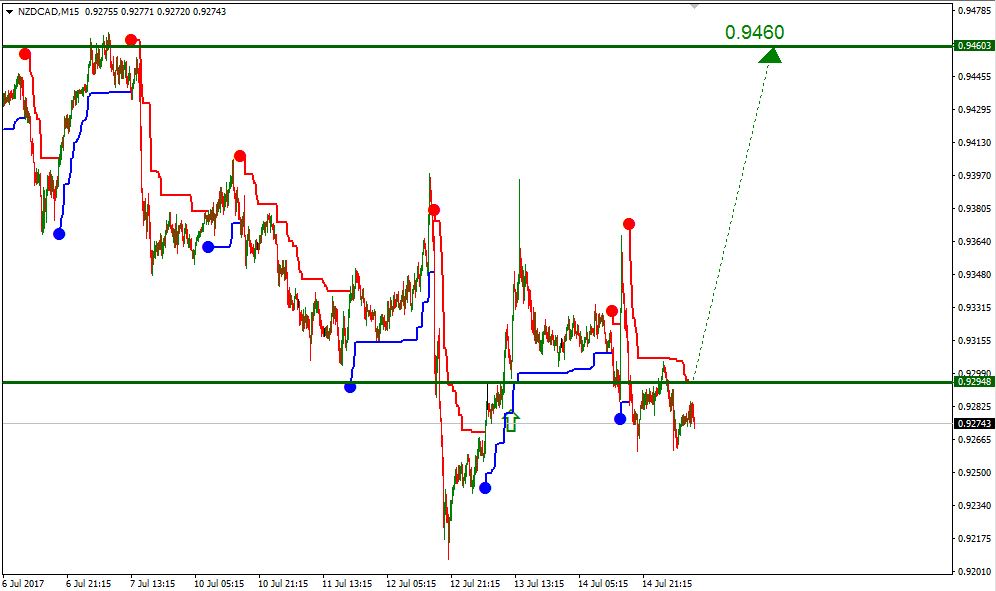
The M15-chart suggests a breakout of the upper line of VoltyChannel indicator, and this will be a confirmation of rebound from 0.9277 and possible rise towards 0.9460.
Forecasts presented in this section only reflect the author’s private opinion and should not be considered as guidance for trading. RoboForex bears no responsibility for trading results based on trading recommendations described in these analytical reviews.