Murrey Math Lines 31.07.2017 (EUR/USD, USD/JPY)
EUR USD, “Euro vs. US Dollar”
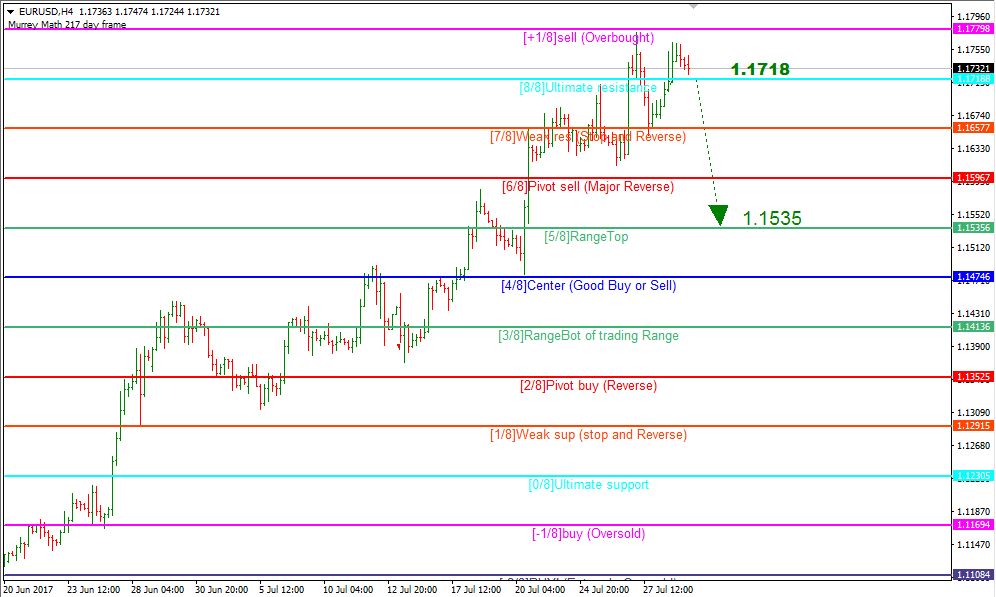
At the H4 chart, the EUR/USD pair is still trading close to the resistance at the 8/8 level at 1.1718. If later the price breaks this level to the downside, it may start another descending movement towards 1.1535.
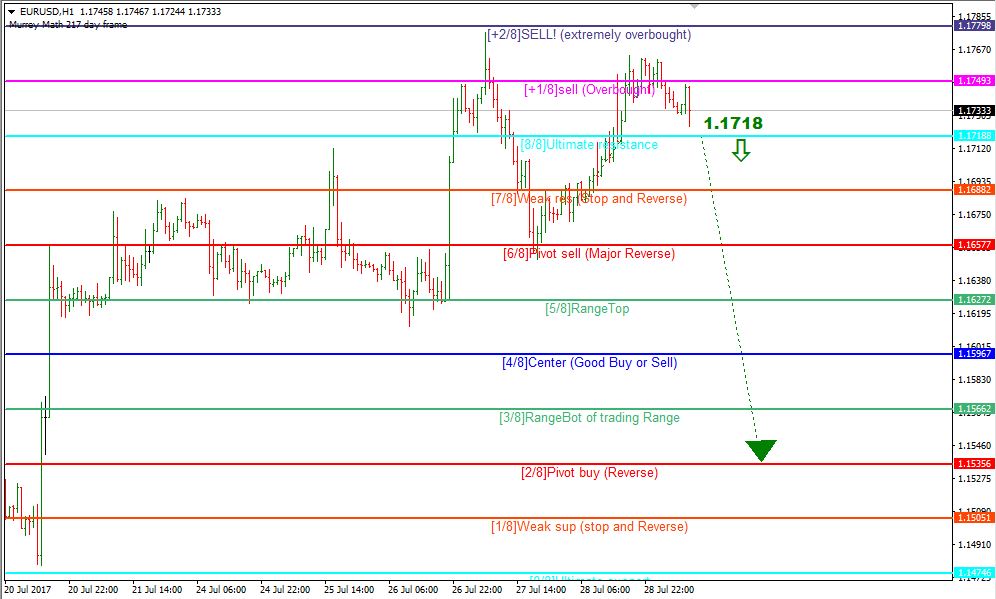
At the H1 chart, the price is also trading near the resistance at the 8/8 level at 1.1718. If the instrument breaks it, the price may start falling to reach 1.1535.
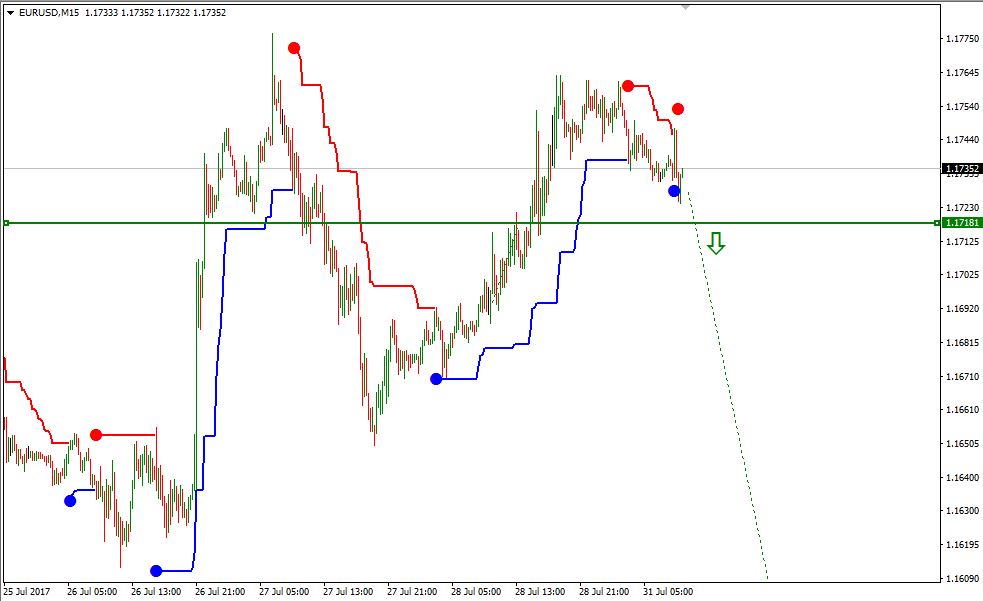
At the M15 chart, the price broke the downside line of the VoltyChannel indicator, which means that the price may break 1.1718 and then continue falling towards 1.1535.
USD JPY, “US Dollar vs. Japanese Yen”
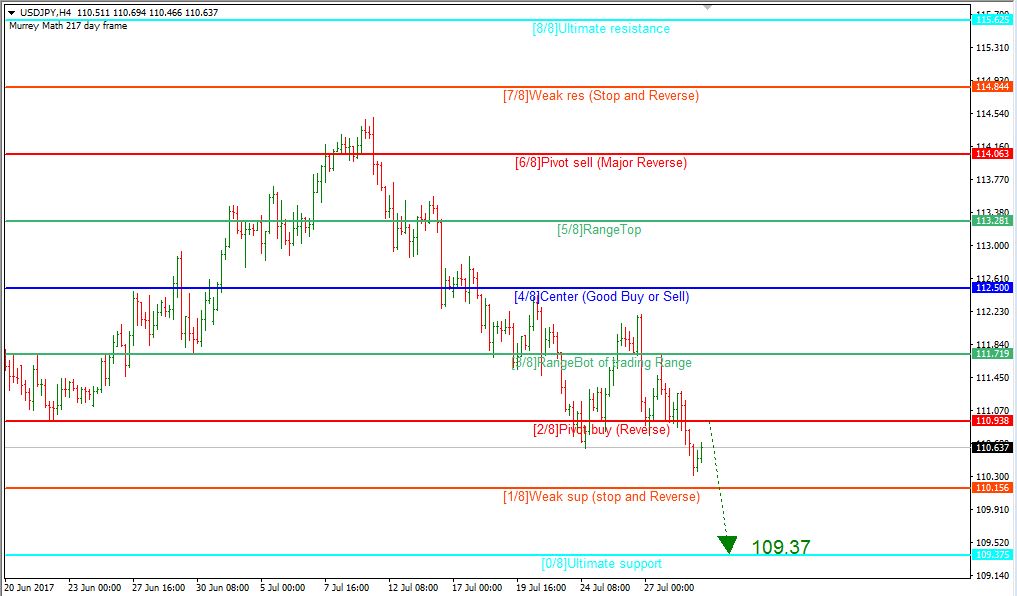
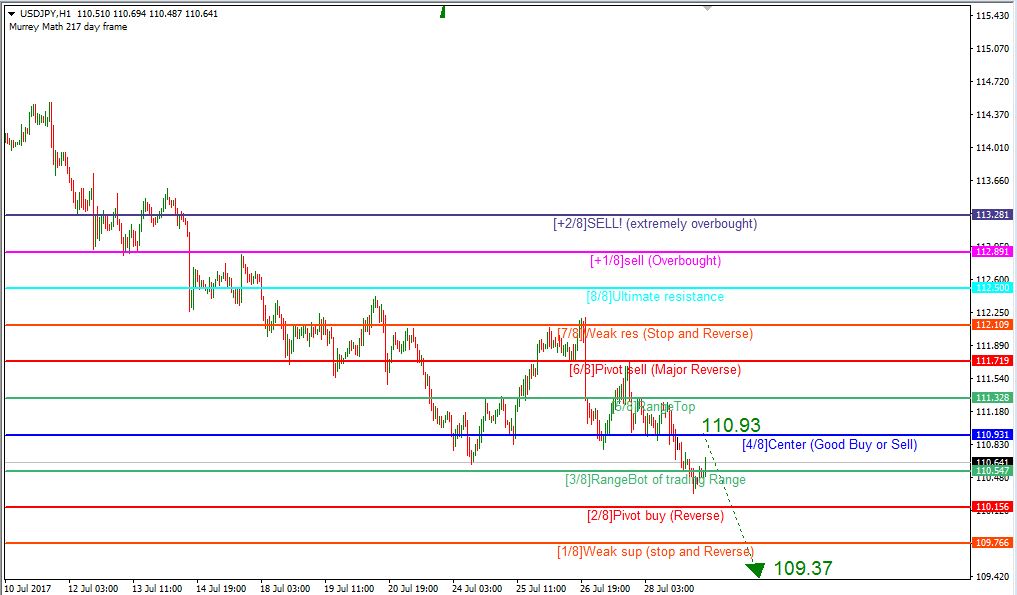
At the H4 chart, the USD/JPY pair is still falling towards the 0/8 level at 109.37. Right now, the price may grow to reach the 2/8 level at 110.93. Later, the pair is expected to rebound and start falling towards 109.37.
At the H1 chart, we can see the resistance at the 4/8 level at 110.93. If the pair rebounds from this level, the price may continue moving downwards to reach the 0/8 level at 109.37.
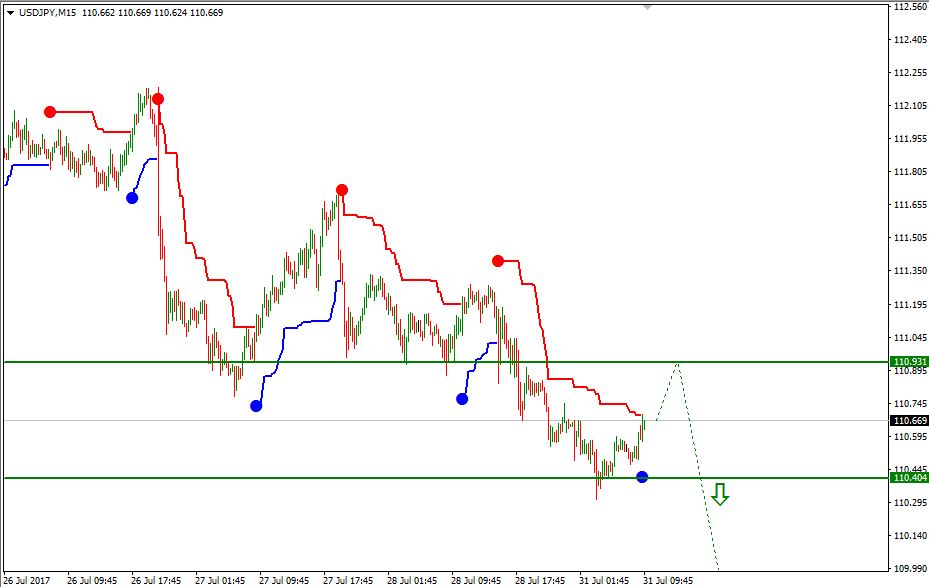
At the M15 chart, the pair is expected to reach 110.93 and then break the downside line of the VoltyChannel indicator. As a result, the price may continue its descending movement towards 109.37.
RoboForex Analytical Department
Forecasts presented in this section only reflect the author’s private opinion and should not be considered as guidance for trading. RoboForex bears no responsibility for trading results based on trading recommendations described in these analytical reviews.