Murrey Math Lines 05.07.2017 (USD/JPY, EUR/USD)
USD JPY, “US Dollar vs. Japanese Yen”
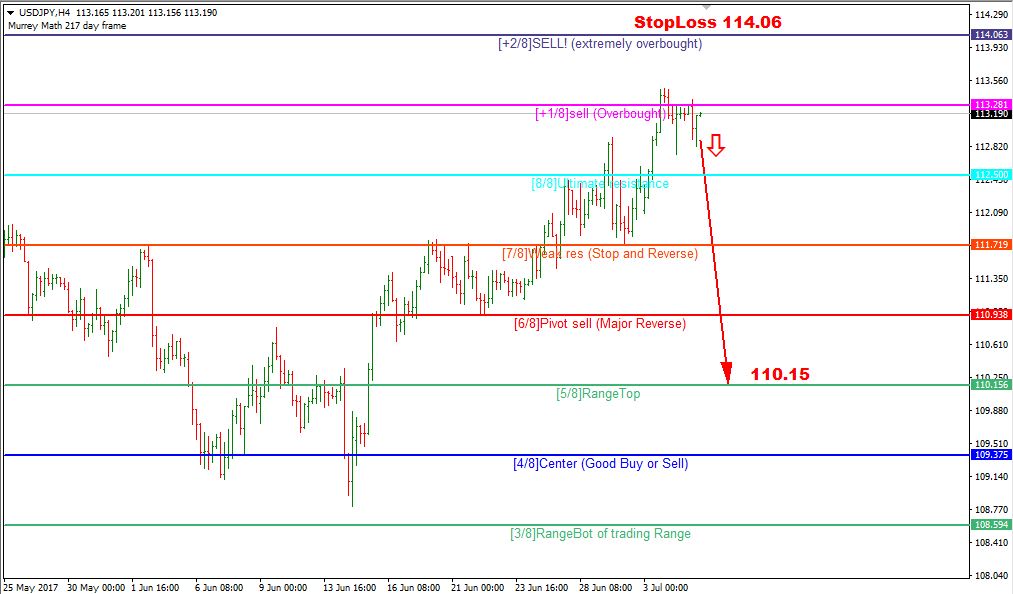
As we can see at the H4 chart, the USD/JPY pair is trading inside the “overbought zone” close to the resistance at the +1/8 level at 113.28. Possibly, the price may start a descending tendency. The first downside target is at the 5/8 level at 110.15.
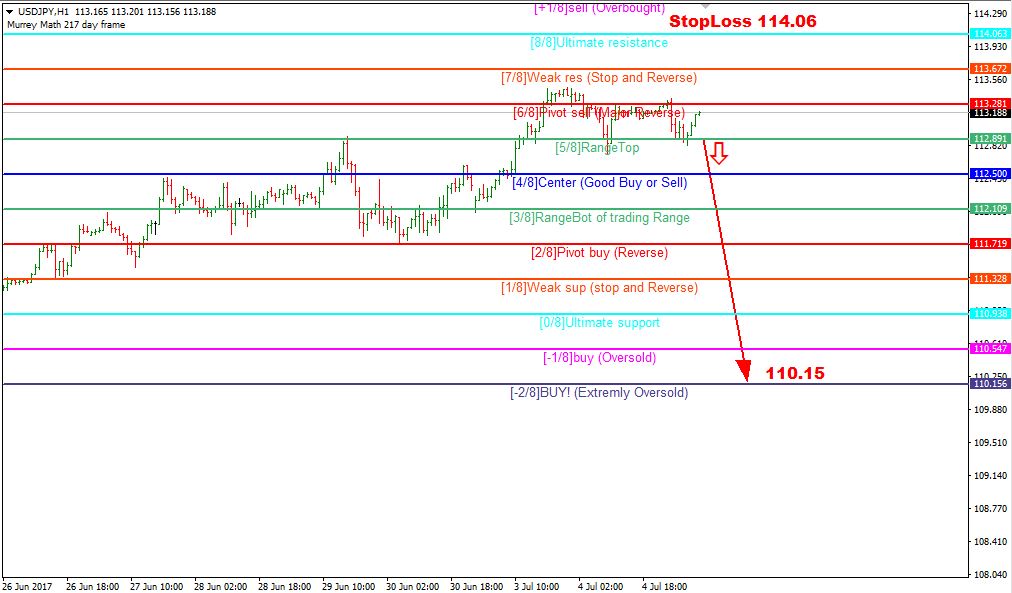
At the H1 chart, we expect the pair to break the 6/8 level at 112.89 and start selling. The Stop Loss is beyond the 8/8 level from the H1 chart at 114.06. The downside target is at the 5/8 level from the H4 chart at 110.15.
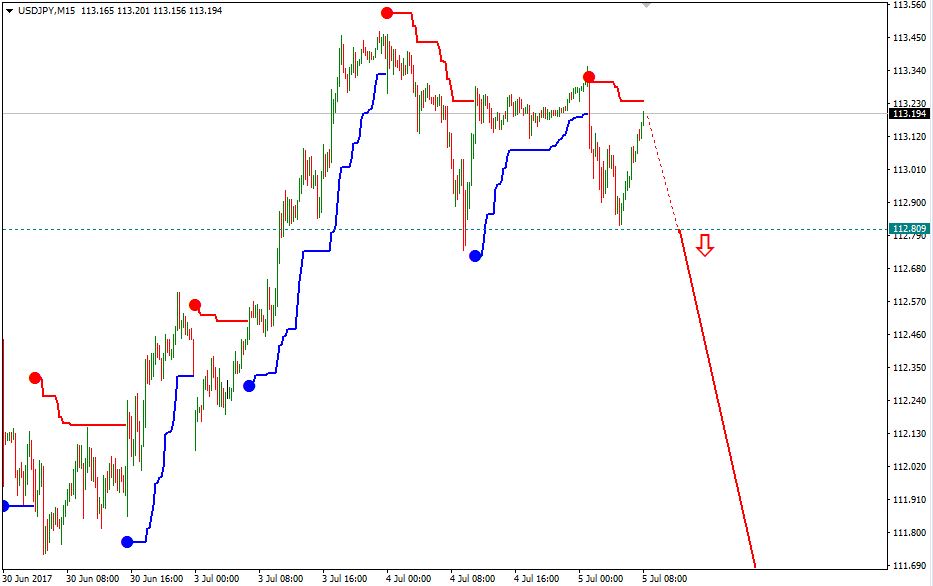
At the M15 chart, the pair broke the downside line of the VoltyChannel indicator, thus providing a signal to sell. We should wait until the price breaks the 6/8 level from the H1 chart at 112.89.
EUR USD, “Euro vs US Dollar”
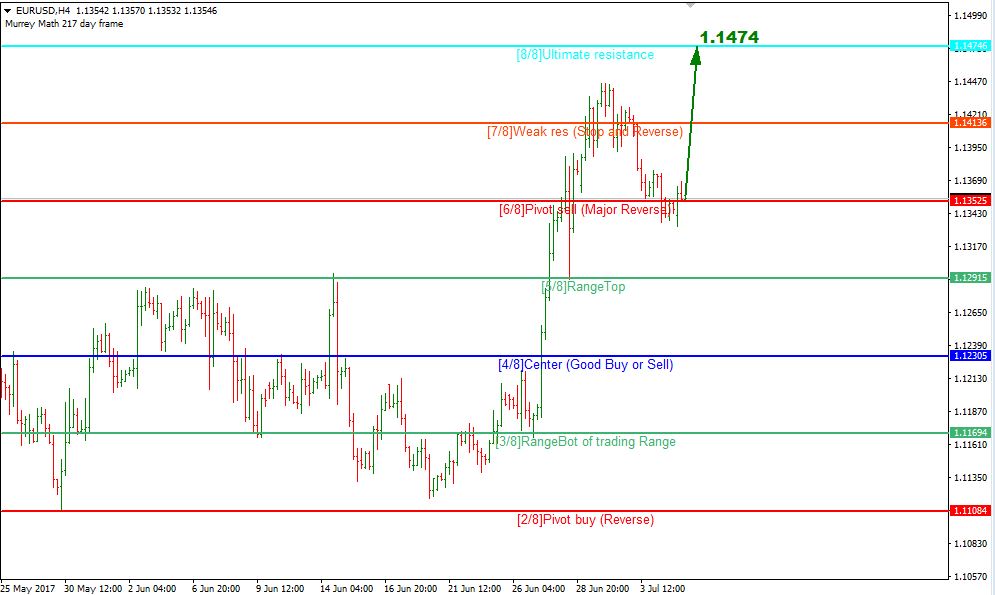
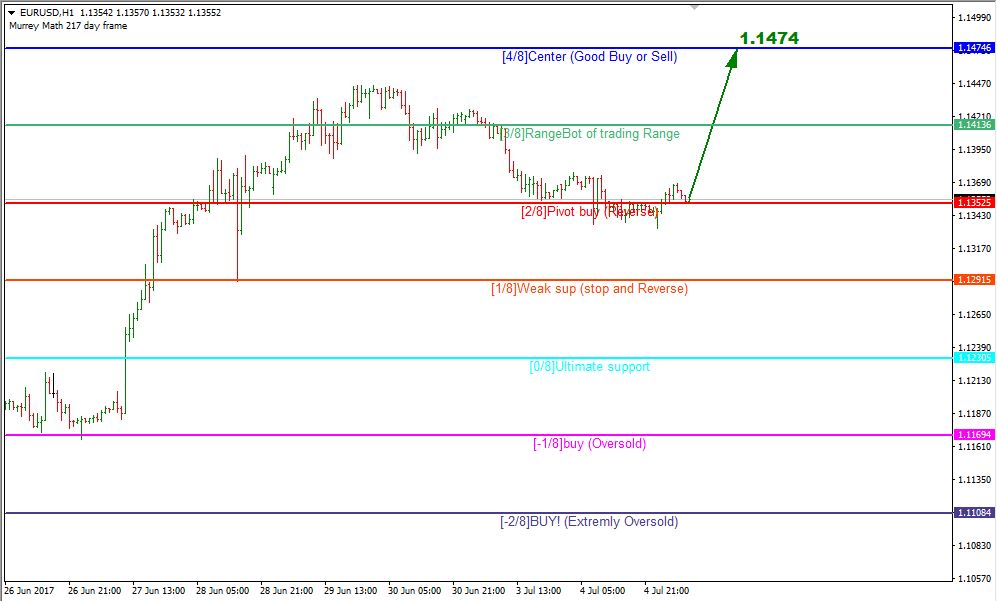
At the H4 chart, the EUR/USD pair may yet move upwards to reach the resistance at the 8/8 level at 1.1474.
As we can see at the H1 chart, the pair is trading at the 2/8 level. In the future, the price is expected to rebounds from the above-mentioned level and then continue moving upwards to reach the resistance at the 8/8 level from the H4 chart at 1.1474.
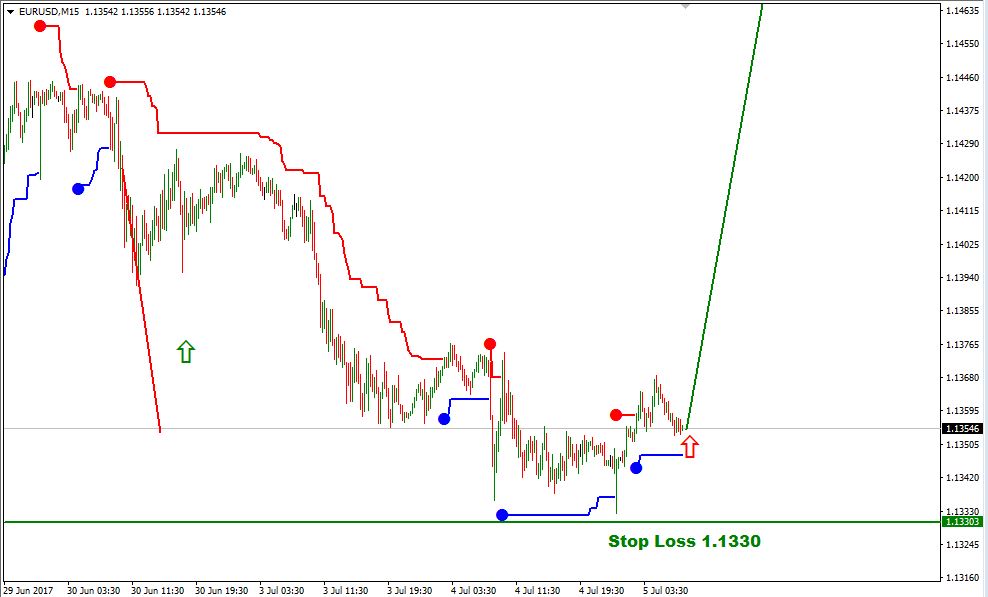
At the M15 chart, the pair broke the upside line of the VoltyChannel indicator. We may start buying at the current price with the Stop Loss beyond 1.1330. The upside target is at the resistance at the 8/8 level from the H4 chart at 1.1474.
RoboForex Analytical Department
Forecasts presented in this section only reflect the author’s private opinion and should not be considered as guidance for trading. RoboForex bears no responsibility for trading results based on trading recommendations described in these analytical reviews.