Wave Analysis 10.05.2017 (EUR/USD, GBP/USD, USD/JPY, AUD/USD)
EUR USD, “Euro vs US Dollar”
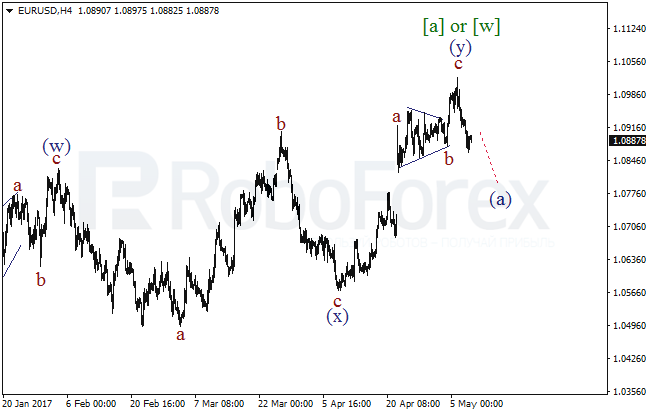
Probably, the EUR/USD pair completed the double zigzag in the wave [a] of [w], which means that the price may resume moving downwards. As a result, in the nearest future the market may form the descending impulse in the wave (a).
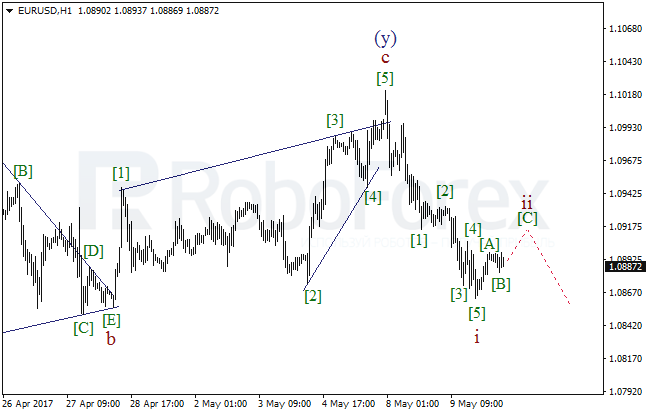
More detailed structure is shown on the H1 chart. It’s highly likely that yesterday the pair completed the bearish impulse in the wave i. In the future, after completing the local correction, the market may continue falling in the wave iii of (iii).
GBP USD, “Great Britain Pound vs US Dollar”
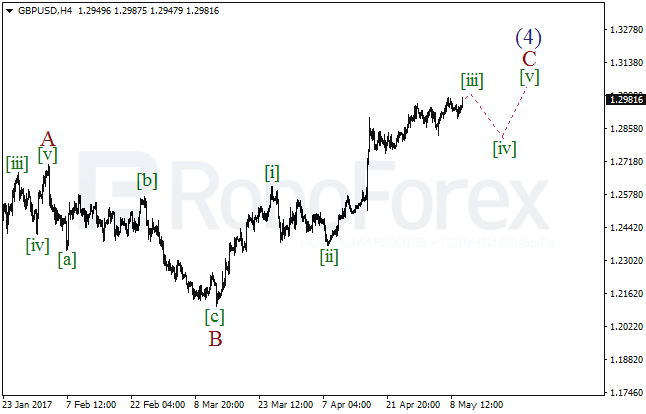
The GBP/USD pair has almost completed the extension in the wave [iii]. Later, the price may yet reach a new local high, but then the market is expected to start a new descending correction in the wave [iv] of C.
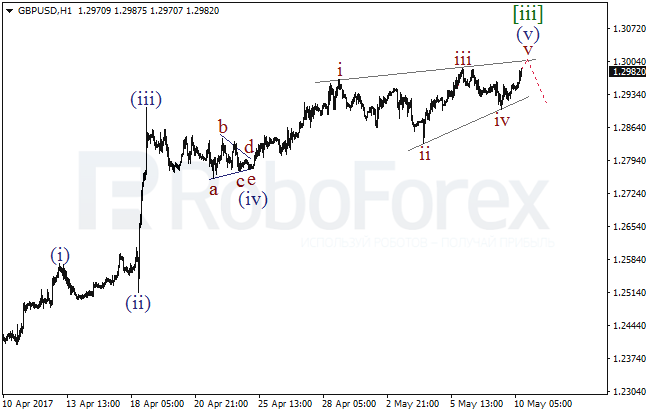
The scenario, which implies that the price is forming the diagonal triangle in the wave (v) of [iii] was confirmed. Yesterday, the pair completed the fourth wave of the pattern. Consequently, on Wednesday the market may continue growing in the wave v or (v). If the price rebounds from the triangle’s upside border, the pair may start a new descending correction.
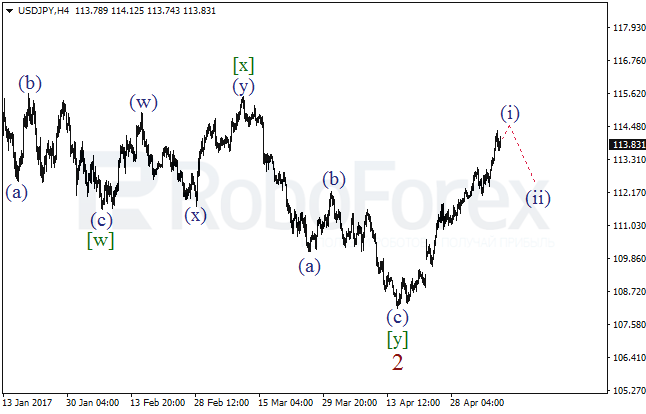
USD JPY, “US Dollar vs Japanese Yen”
The USD/JPY pair is about to complete the ascending impulse in the wave (i). On Wednesday, the market may break a local high, but later the price is expected to start a new descending correction in the wave (ii).
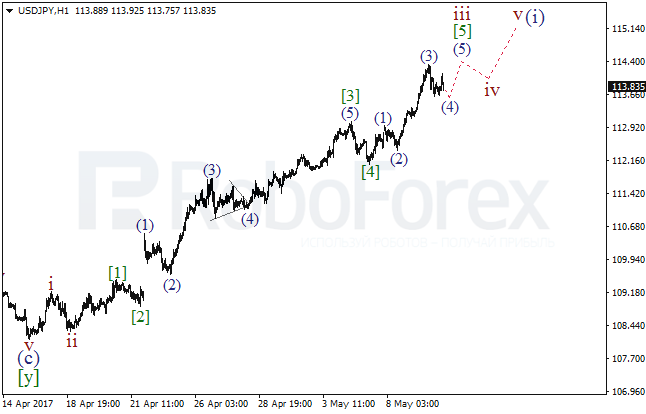
More detailed structure is shown on the H1 chart. The pair is forming the fifth wave of the extended wave iii. Right now, the price is being corrected in the wave (4) of [5]. Consequently, in the future the market may resume growing in the wave (5) of [5] of iii and break the previous high.
AUD USD, “Australian Dollar vs US Dollar”
The AUD/USD pair finished the wave [ii] in the form of the flat and resumed moving downwards. Possibly, right now the price is forming the descending extension in the wave [iii]. In the nearest future, the market may continue falling in the wave (iii) of [iii].
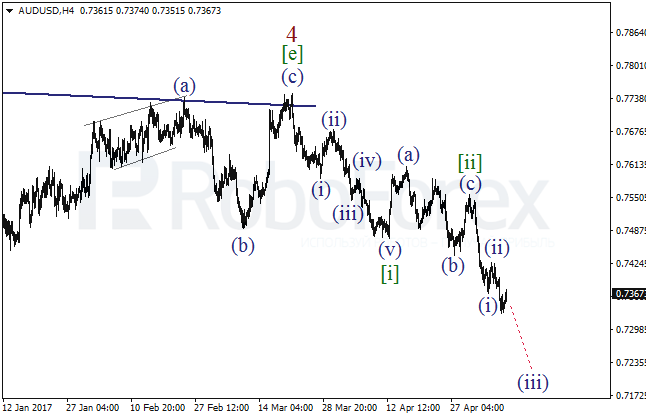
As we can see at the H1 chart, after finishing the wave i of (iii), the pair started another correction. During the next several hours, the market may continue forming the descending wave ii, which may later be followed by a new decline in the wave iii of (iii).

RoboForex Analytical Department
Forecasts presented in this section only reflect the author’s private opinion and should not be considered as guidance for trading. RoboForex bears no responsibility for trading results based on trading recommendations described in these analytical reviews.