Murrey Math Lines 25.06.2019 (AUDUSD, NZDUSD)
AUDUSD, “Australian Dollar vs US Dollar”
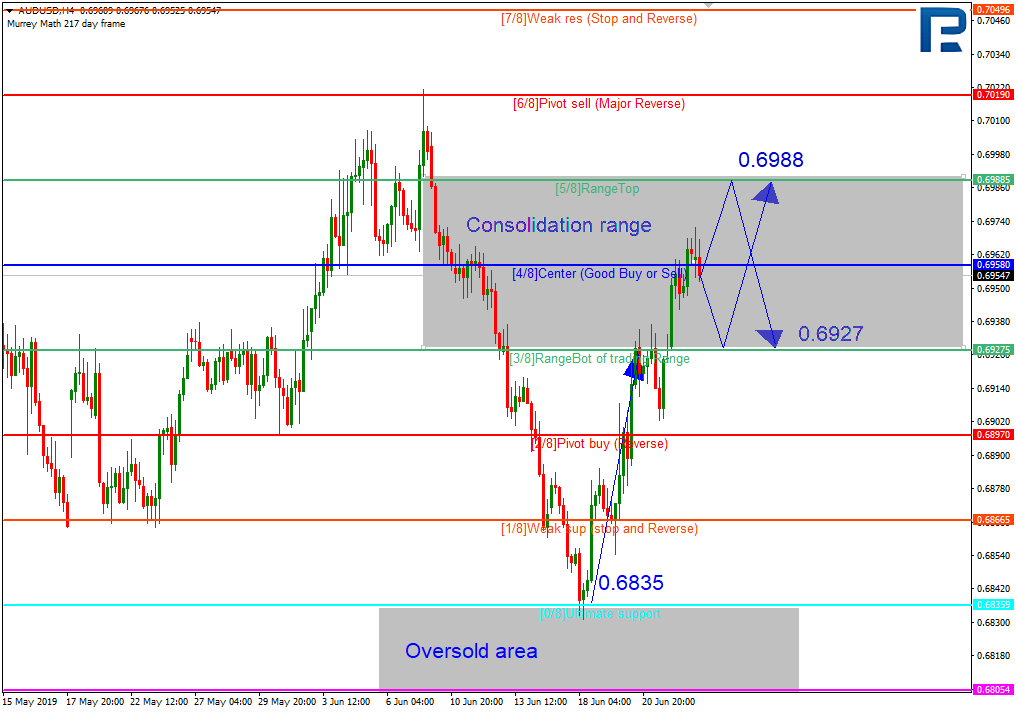
As we can see in the H4 chart, AUDUSD has reached the predicted target; right now, it is consolidating between 3/8 and 5/8. Possibly, the pair may continue moving inside this range for some time, while bulls and bears are fighting for further direction of the price movement. In this case, there are two possible scenarios. The first scenario implies that the instrument may test 3/8, rebound from it, and then resume growing to reach the resistance at 5/8. According to the second one, the pair may do the opposite.

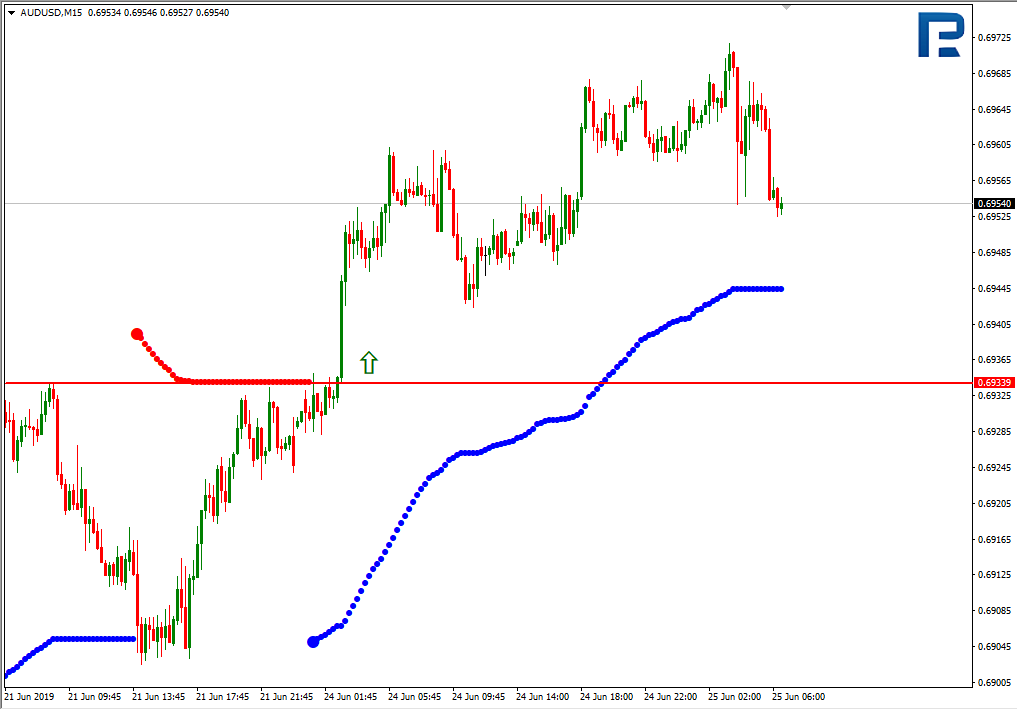
As we can see in the M15 chart, the pair has broken the upside line of the VoltyChannel indicator and, as a result, continue trading upwards. That’s why the most probable scenario is the price’s testing 5/8 from the H4 chart.
NZDUSD, “New Zealand Dollar vs US Dollar”
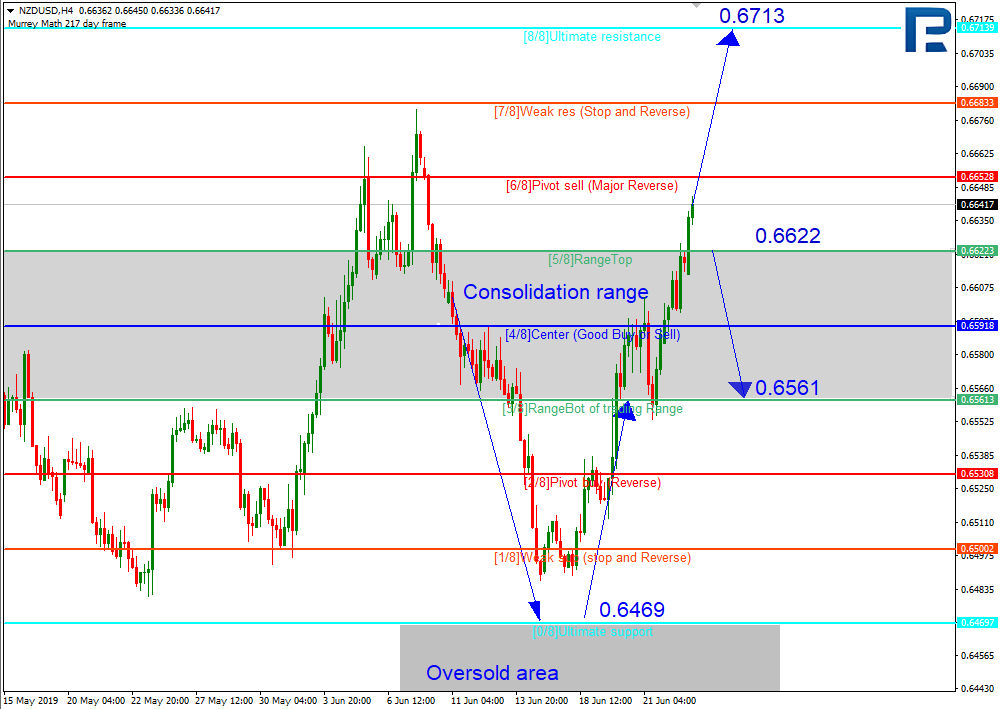
In the H4 chart, NZDUSD is trading above 5/8 and may continue growing towards the resistance at 8/8. However, this scenario may no longer be valid if the price breaks 5/8. In this case, the instrument may continue falling towards the support at 3/8.
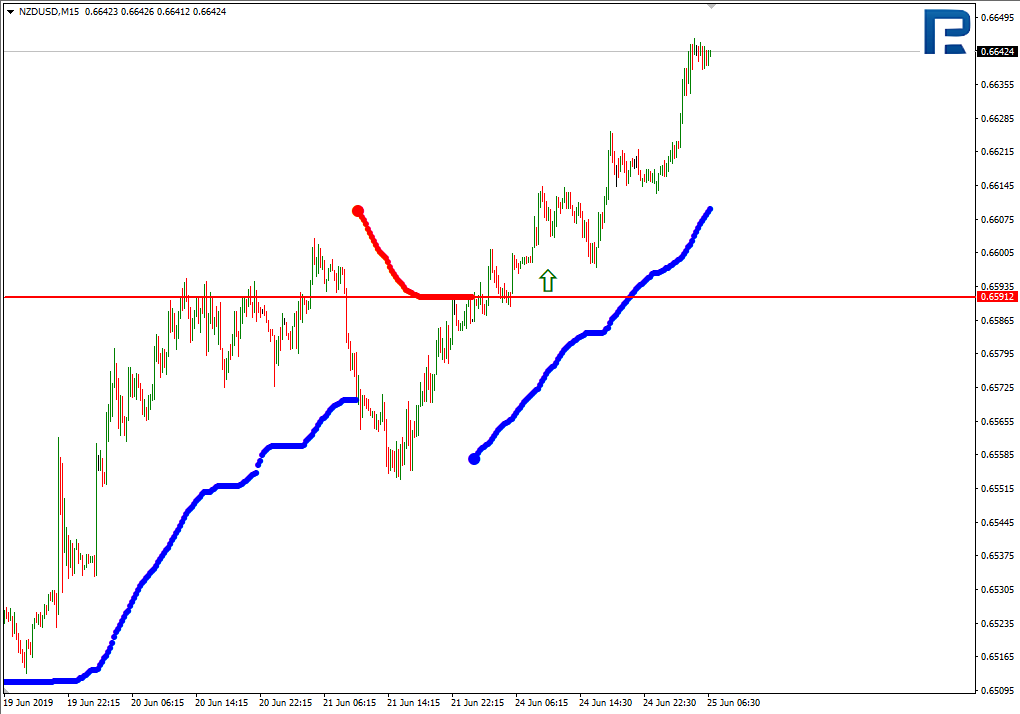
As we can see in the M15 chart, the pair has broken the upside line of the VoltyChannel indicator and, as a result, may continue moving upwards.
Forecasts presented in this section only reflect the author’s private opinion and should not be considered as guidance for trading. RoboForex bears no responsibility for trading results based on trading recommendations described in these analytical reviews.