Murrey Math Lines 30.05.2019 (USDCHF, GOLD)
USDCHF, “US Dollar vs Swiss Franc”
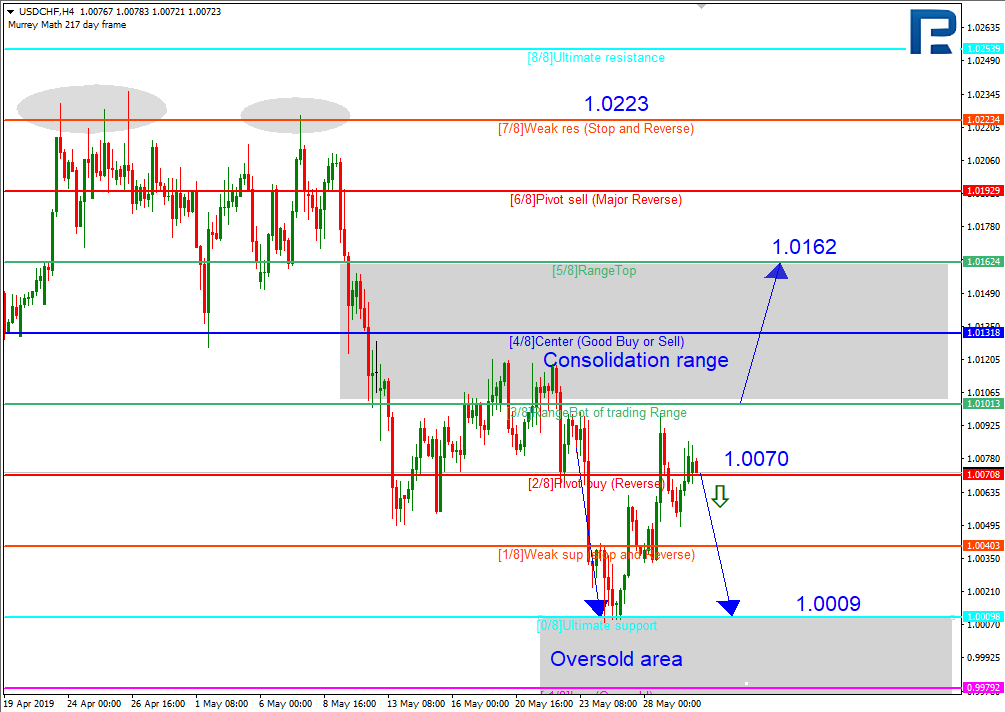
As we can see in the H4 chart, after reaching its downside targets specified a weak earlier, USDCHF has been corrected towards the 3/8 level. In this case, the price may break the 2/8 level and then continue falling to reach the support at the 0/8 level. However, this scenario may no longer be valid if the instrument breaks the 3/8 level. After that, the pair may resume trading upwards to reach the resistance at the 5/8 level.

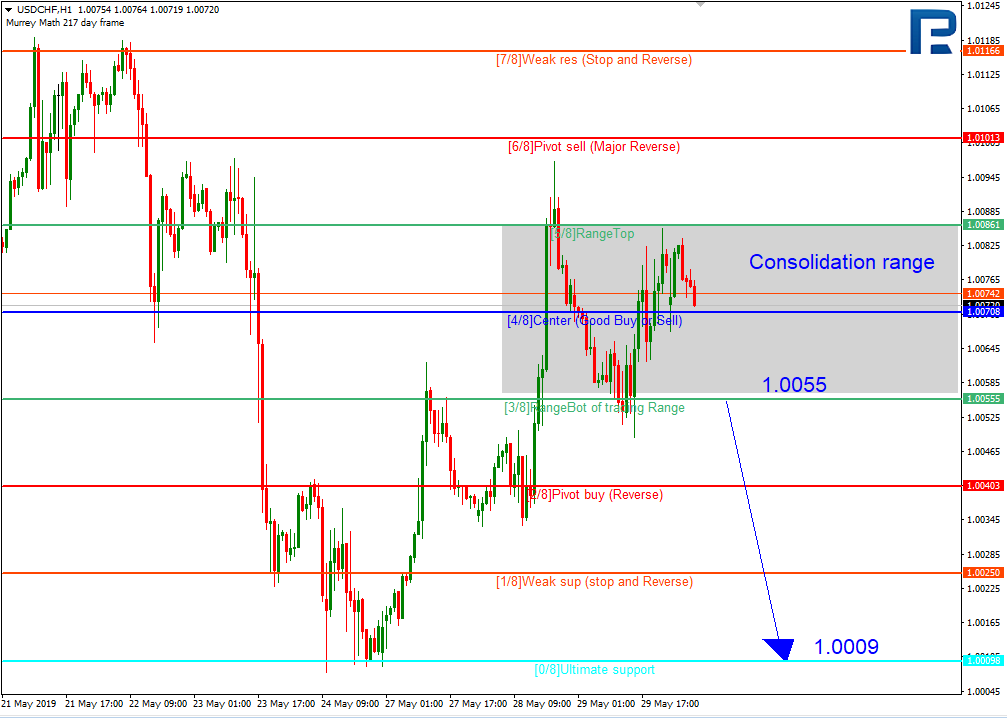
In the H1 chart, the pair is consolidating. If the price breaks the 3/8 level, the instrument may resume falling to reach the support at the 0/8 one.
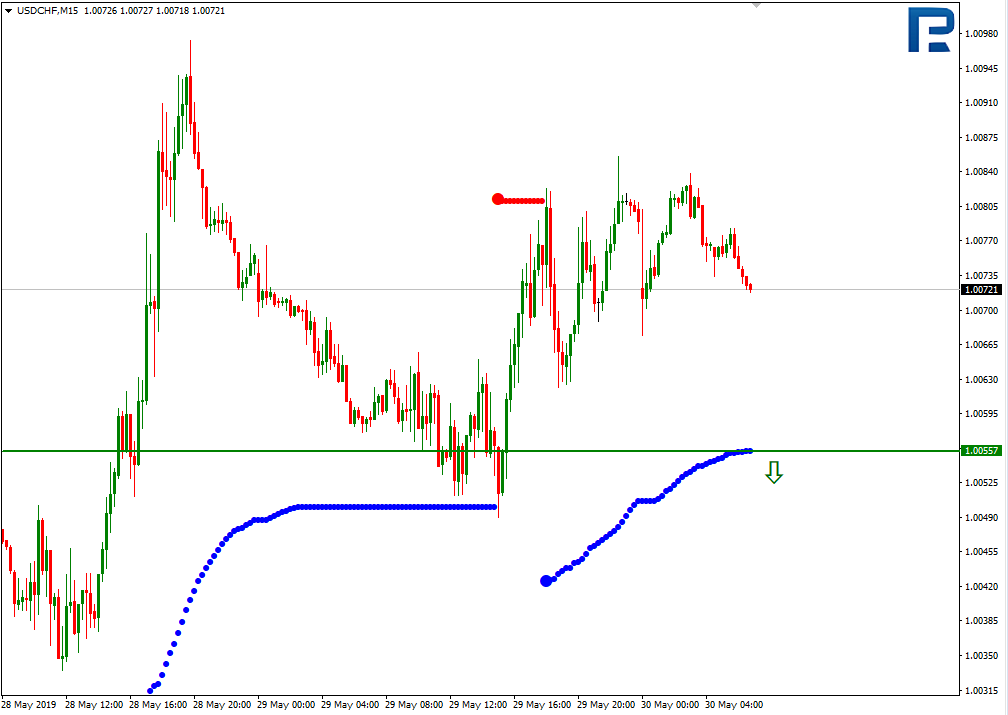
In the M15 chart, the pair may break the downside line of the VoltyChannel indicator and, as a result, continue trading downwards.
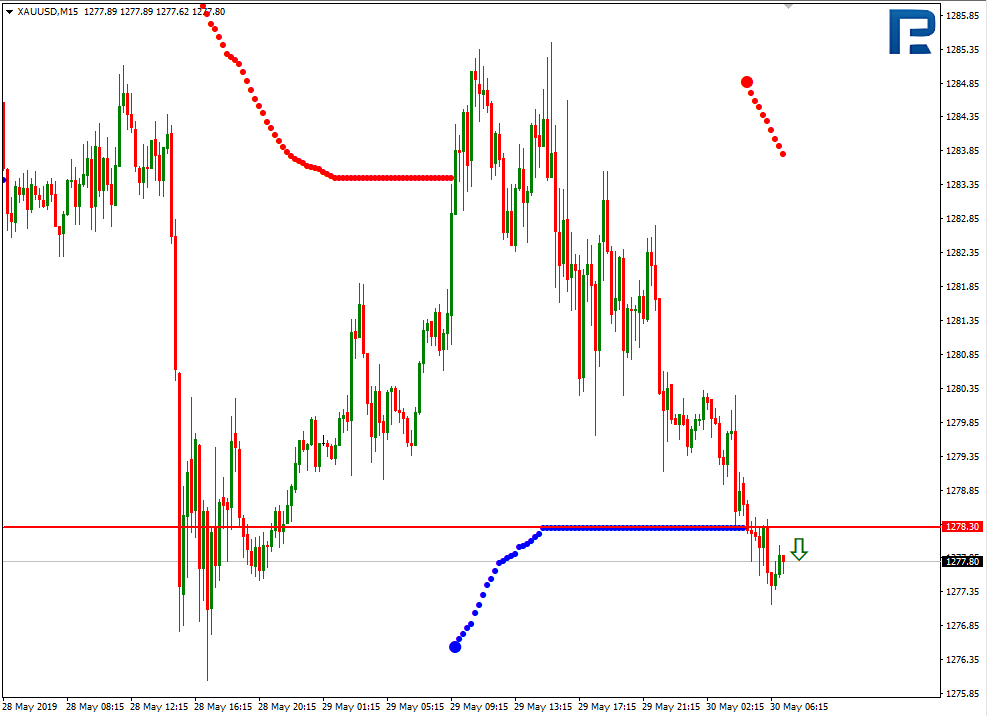
XAUUSD, “Gold vs US Dollar”
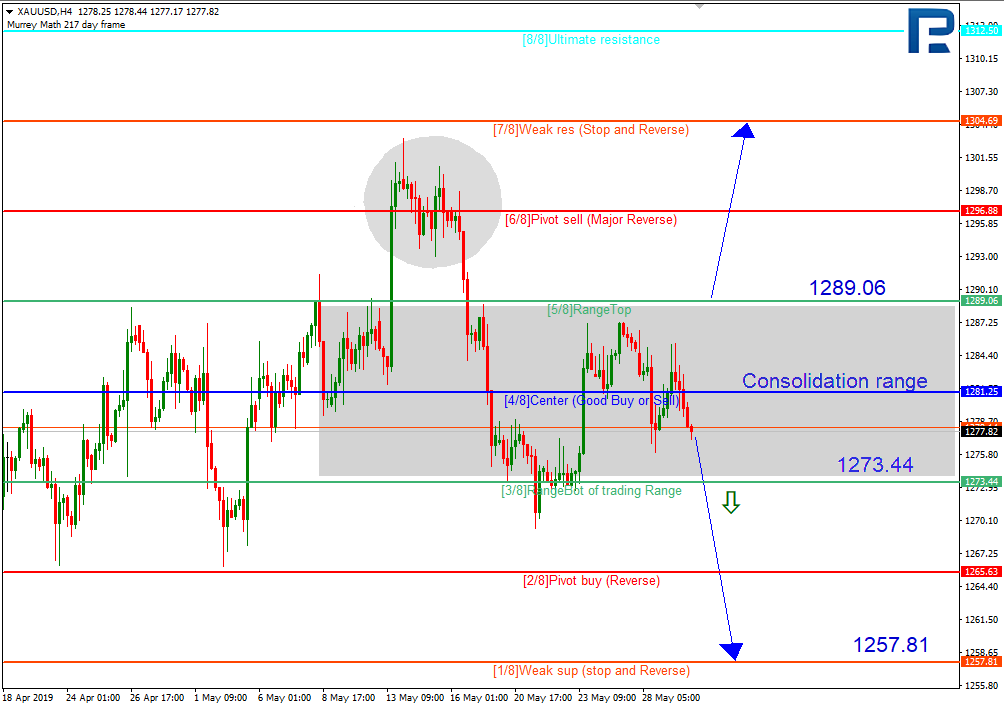
As we can see in the H4 chart, XAUUSD is consolidating. On May 13th, there was a quick rising impulse that stopped at the 6/8 level. In this case, there was a possibility of a new descending movement and, indeed, the price plummeted towards the 3/8 level, but later formed another correction to reach the resistance at the 5/8 one. As a result, we saw the first descending wave along with the correction. In the future, the descending tendency may continue. After the instrument breaks the 3/8 level, it may continue trading downwards to reach the support at the 1/8 one. However, this scenario may no longer be valid if the instrument breaks the 5/8 level. After that, the pair may resume trading upwards to reach the resistance at the 7/8 level.
As we can see in the M15 chart, the pair has broken the downside line of the VoltyChannel indicator and, as a result, may continue moving downwards.
Forecasts presented in this section only reflect the author’s private opinion and should not be considered as guidance for trading. RoboForex bears no responsibility for trading results based on trading recommendations described in these analytical reviews.