Wave Analysis 12.09.2013 (DJIA Index, Crude Oil)
12.09.2013
Analysis for September 12th, 2013
DJIA Index
The chart current structure chart implies that the Index completed an ascending zigzag pattern inside wave [B]. Earlier the price formed a bearish impulse inside wave [A]. During the next several hours, the instrument is expected to start falling down inside an initial wave (1).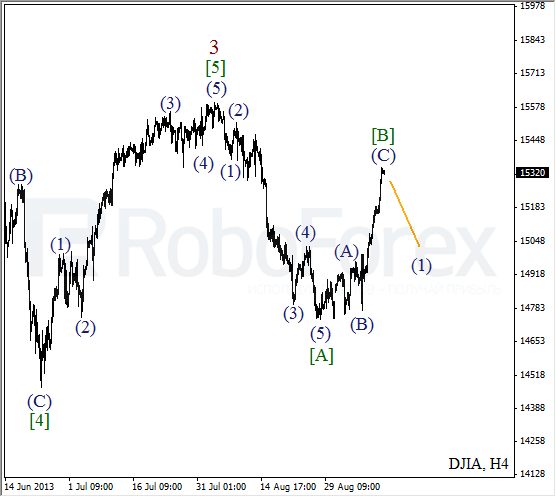
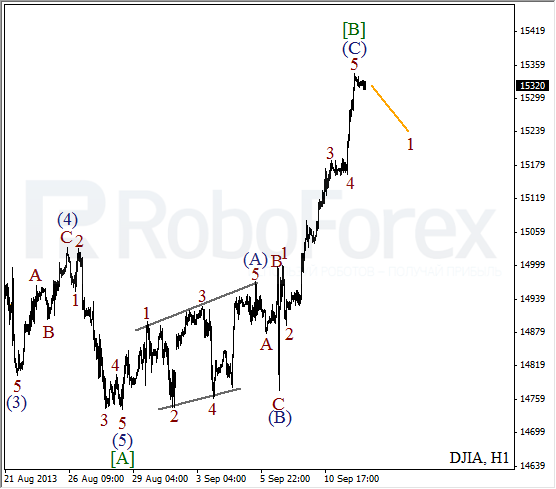
More detailed wave structure is shown on the H1 chart. We may assume that the price finished an impulse inside wave (C). On the other hand, there is a possibility that the Index may form an extension inside wave 5, that’s why I’ll open a sell order only after the price completes a bearish impulse inside wave 1.
Crude Oil
We can’t exclude a possibility that the market finished the second wave inside diagonal triangle pattern. Right now, the market is trying to start a new ascending movement inside wave 3. If the bulls are able to continue pushing the price upwards, I’ll increase my long position.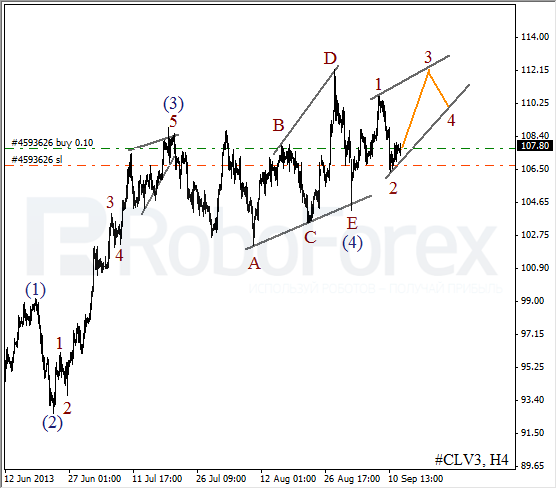
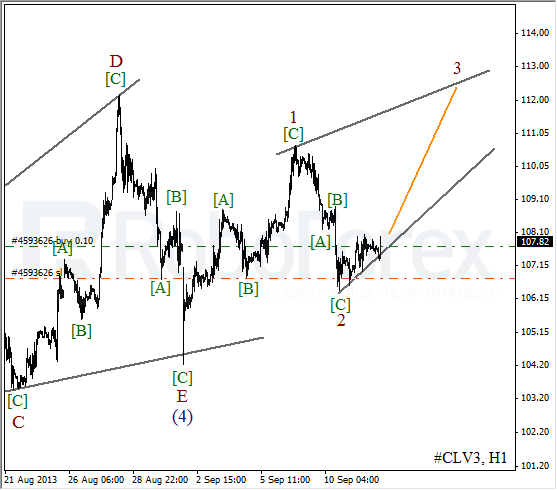
As we can see at the H1 chart, the price formed zigzag pattern inside wave 2. On the minor wave level, the instrument completed a short initial ascending impulse. I’ll move the stop into the black as soon as the price breaks a local maximum.
RoboForex Analytical Department
Attention!
Forecasts presented in this section only reflect the author’s private opinion and should not be considered as guidance for trading. RoboForex bears no responsibility for trading results based on trading recommendations described in these analytical reviews.