Wave Analysis 26.09.2013 (DJIA Index, Crude Oil)
26.09.2013
Analysis for September 26th, 2013
DJIA Index
The Index continues forming diagonal triangle pattern inside wave [5]. On the minor wave level, the price is forming the fourth wave. If the market rebounds from the pattern’s lower border, the instrument will start a new ascending movement inside wave (5) of [5].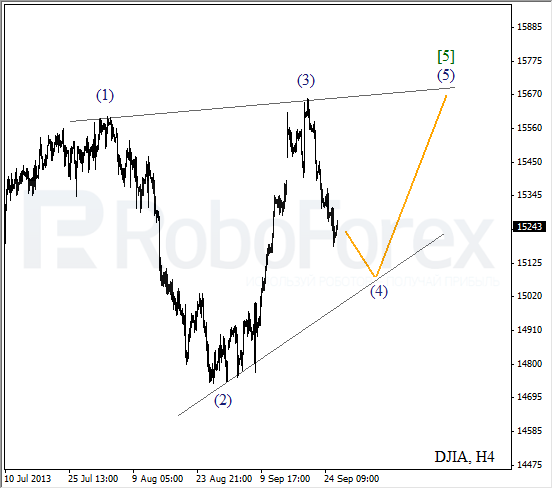
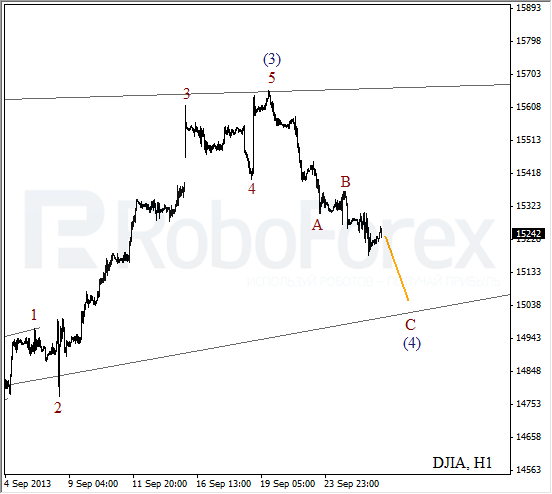
More detailed wave structure is shown on the H1 chart. It looks like the price is forming wave (4) in the form of zigzag pattern with a descending wave C inside it. In the near term, the Index is expected to continue falling down.
Crude Oil
Oil is still being corrected. We may assume that the price is forming double three pattern inside the fourth wave. The correction may continue for a while, but later the instrument is expected to form an initial ascending impulse.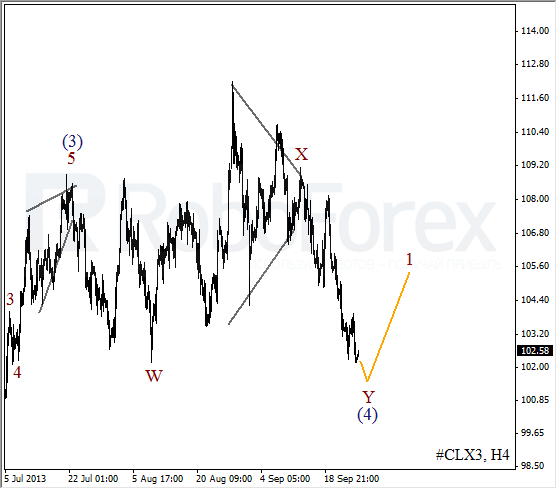
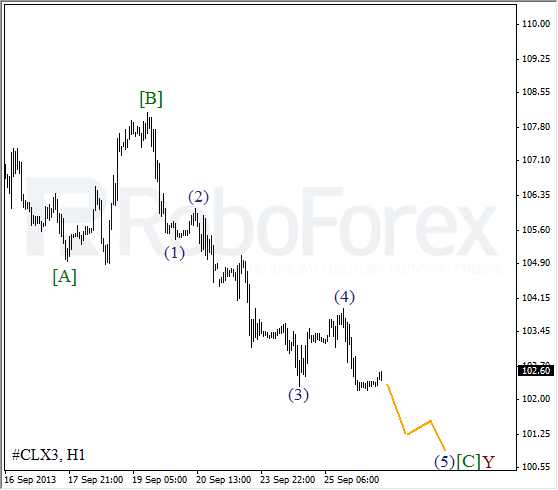
As we can see at the H1 chart, the price is forming the fifth wave inside wave [C]. The current chart structure implies that the instrument may continue falling down for a while, but later the market is expected to make a reverse.
RoboForex Analytical Department
Attention!
Forecasts presented in this section only reflect the author’s private opinion and should not be considered as guidance for trading. RoboForex bears no responsibility for trading results based on trading recommendations described in these analytical reviews.